
Fig. 2.
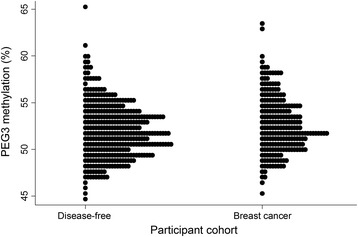
Distribution of average PEG3 methylation levels. The distribution of the average PEG3 methylation levels (percent—%) are presented for each participant cohort: disease-free women and breast cancer cases. Breast cancer cases include IDC and DCIS patients. Each participant is represented by a filled circle. PEG3 paternally expressed gene 3, IDC invasive ductal carcinoma, DCIS ductal carcinoma in situ