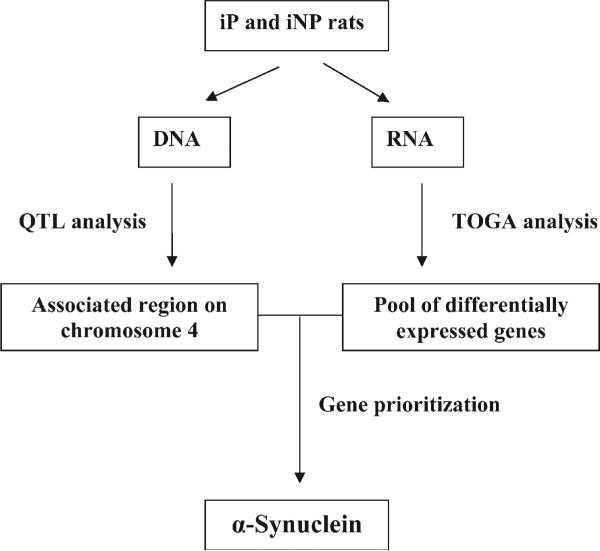
Figure 1.
Complementary experimental approaches. The flow chart depicts the incorporation of rats selectively bred for alcohol preference [inbred alcohol-preferring (iP) and -non-preferring (iNP)], quantitative trait loci analysis (QTL), and total gene expression analysis (TOGA) to identify a candidate gene(s) for alcohol preference (Sutcliff et al., 2000).

