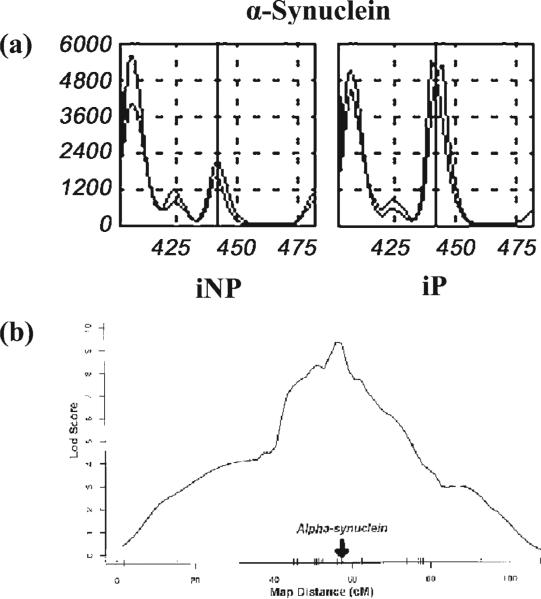
Figure 2.
TOGA and QTL analysis yield a candidate gene: α-synuclein. (a) TOGA profile for the product corresponding to rat α-synuclein. α-synuclein was among the mRNAs identified by TOGA® as being expressed at higher levels in iP vs. iNP rat hippocampus (Liang et al., 2003). A vertical solid line is drawn through the PCR product corresponding to rat α-synuclein. (b) Multipoint lod score computed for alcohol preference with the program Mapmaker/QTL (Lander et al., 1987). α-synuclein mapped to the peak of this chromosome 4 QTL region (arrow) (Liang et al., 2003).

