Fig. 2.

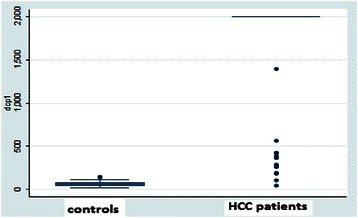
Box Plot for DCP in the HCC cases and non-HCC controls. Outliers are smaller than the lowest quartile minus three times the interquartile range or larger than the highest quartile plus 3 times the interquartile range

Box Plot for DCP in the HCC cases and non-HCC controls. Outliers are smaller than the lowest quartile minus three times the interquartile range or larger than the highest quartile plus 3 times the interquartile range