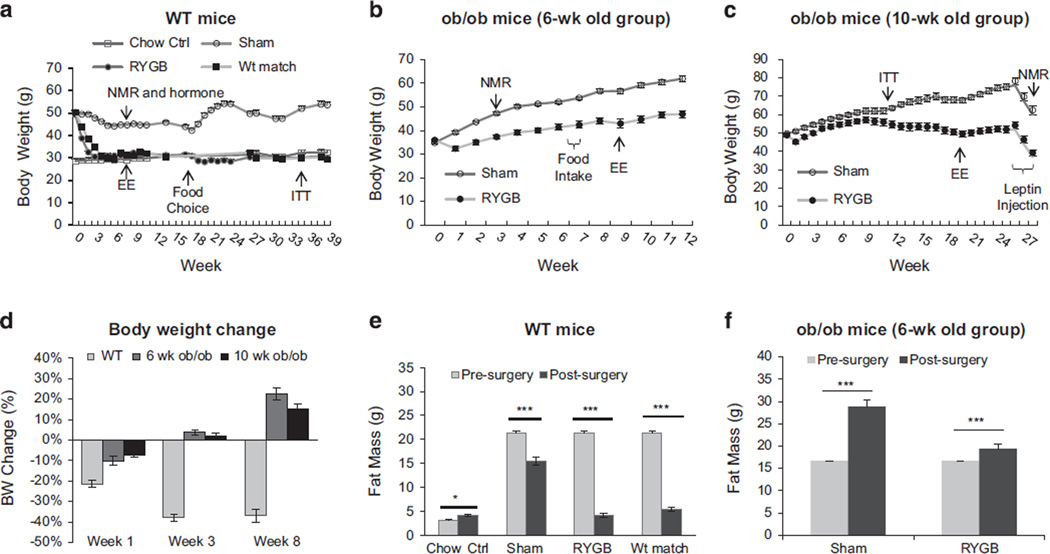
Figure 1.
Body weight and fat content after RYGB. (a) Body weight of WT mice (DIO). The mice were divided into four groups: chow diet control (Chow Ctrl), Sham-operated, RYGB and weight matched (Wt match). The mice were fed HFD before surgery and the breeder chow (medium fat) diet after surgery. RYGB was performed in the mice around 14 wks on HFD. Body weight was monitored weekly in the first 4 wks and then biweekly for 39 wks. Body composition and energy expenditure (EE) were tested at 7 wks. Food choice test was conducted at 16 wks, where the mice had free access to the HFD and the regular chow diet for 6 wks. ITT was tested at 35 wks (N = 7 Chow Ctrl, 7 Sham, 7 RYGB, 7 Wt match). (b) ob/ob mice (6-wk-old group, n = 5). RYGB was performed in the mice at 6 wks in age. Body weight was monitored for 39 wks with composition test at 3 wks, food intake at 6–7 wks, and EE at 8–9 wks post surgery. (c) ob/ob mice (10-wk-old group, n = 6). RYGB was performed in the mice at 10 wks in age. The body weight was monitored for 27 wks with ITT at 11 wks, EE at 19 wks and leptin treatment at 25 wks. (d) Percentage weight loss after RYGB. WT and ob/ob mice were compared in percentage weight loss after RYGB at three time points as indicated. (e) Body fat content of WT mice. Body composition was monitored at 8 wks after RYGB (N = 8 Chow, 7 Sham, 8 RYGB, 7 Wt match). (f) Body fat content of ob/ob mice (6-wk-old group). The body composition was measured at 3 wks after RYGB (n = 5). The data are expressed as mean ± s.e. *P < 0.05, ***P < 0.001 vs before surgery or calorie restriction by t-test.

