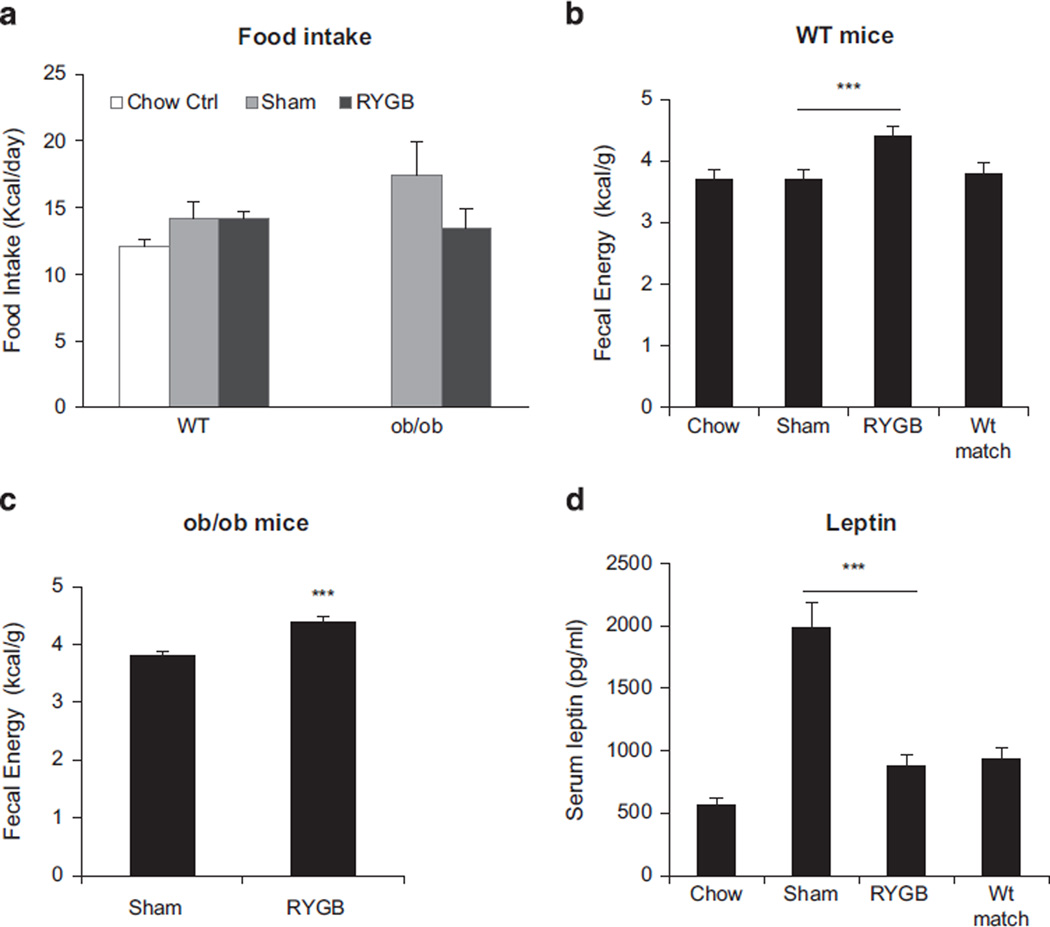
Figure 2.
Energy intake and fecal calorie content after RYGB. (a) Energy intake of WT and ob/ob mice. The mice were single housed and food intake was measured for 3 days after 4 day adaptation. The food intake was conducted at 6 wks post surgery and expressed in kcal per day per mouse (N = 5–6). (b) Fecal calorie content in WT mice (N = 5–6). The test was done at 39 wks post surgery with dry feces. (c) Fecal calorie content in ob/ob mice of the 9-wk-old group (n = 5). The test was done at 23 wks post surgery. (d) Serum leptin. The test was conducted in fasting blood at 6 wks after RYGB. The data are expressed as mean ± s.e. ***P < 0.001 vs sham control by t-test.

