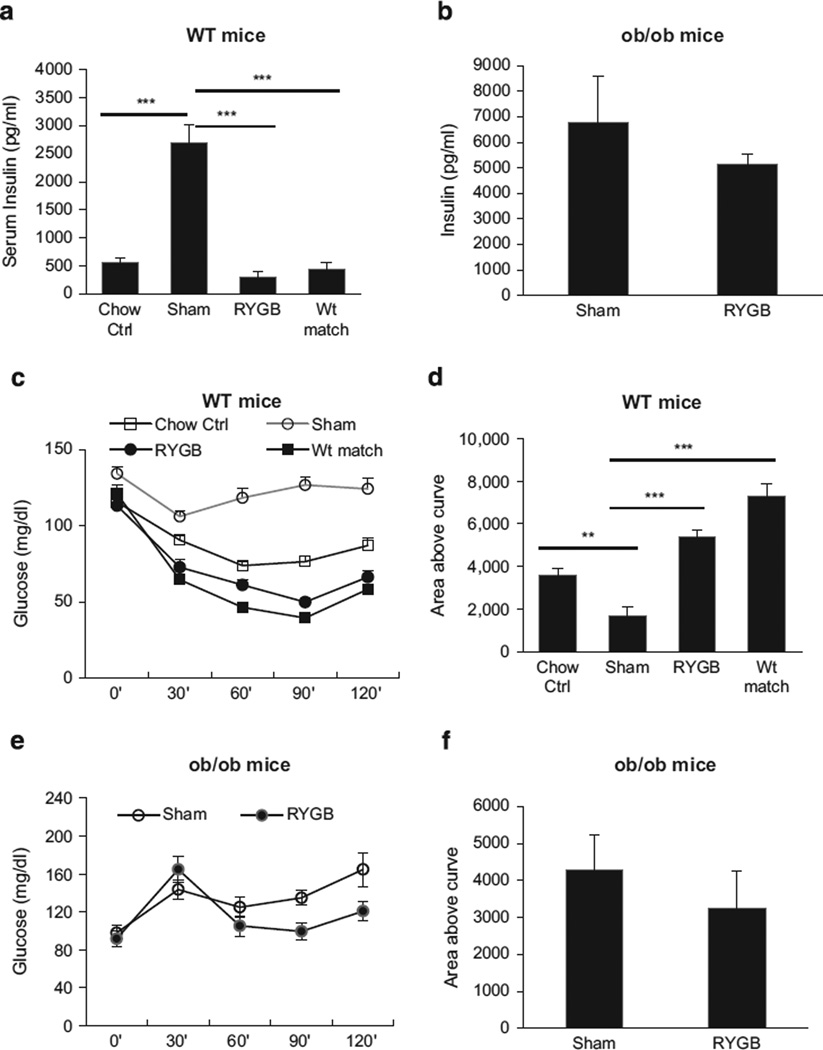
Figure 4.
Insulin sensitivity. (a) Fasting insulin of WT mice. The fasting blood insulin was examined at 6 wks after RYGB. (b) Fasting insulin in ob/ob mice of the 6-wk-old group. (c) Insulin tolerance test (ITT) in WT mice. Insulin was administrated at 0.7 U kg−1 by i.p. injection. (d) Area above the curve for ITT in WT mice. (e) ITT in ob/ob mice (10-wk group). ITT was conducted at 11 wks post surgery. (f) Area above the curve (AAC) of ob/ob mice. The data are expressed as mean ± s.e. **P < 0.01, ***P < 0.001 vs sham by t-test. In this study, mouse number is n = 7 (WT), and n = 6 (ob/ob).

