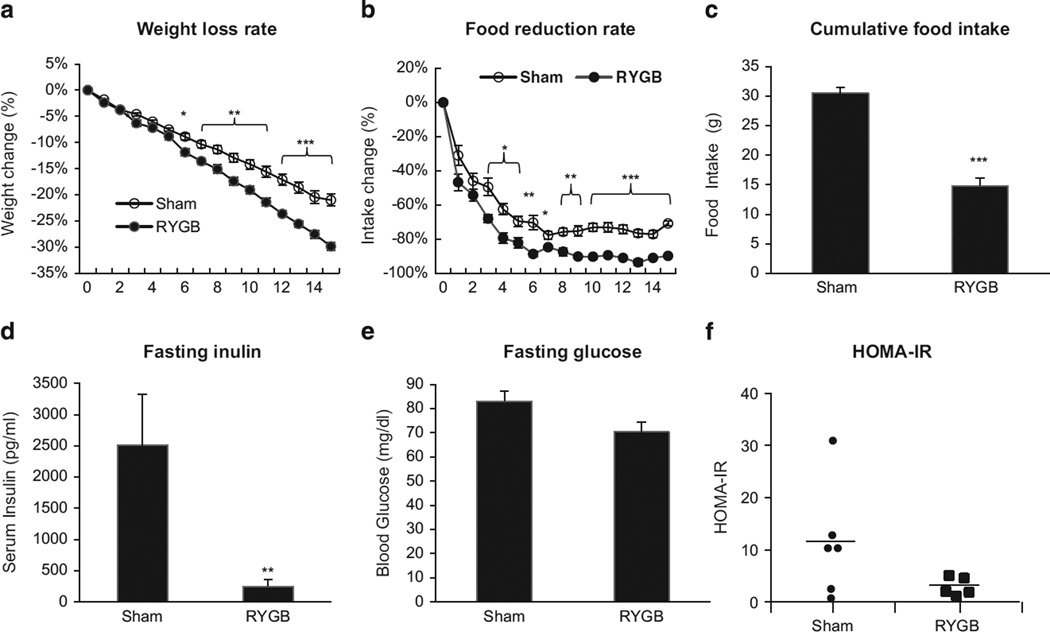
Figure 5.
Leptin effect in ob/ob mice. Leptin was administrated in ob/ob mice (9-wk group) at 25 wks after RYGB. (a) Weight loss rate. The reduction in body weight was calculated in percentage relative to the pre-treatment level. (b) Reduction rate in daily food intake. The reduction was in percentage relative to the pretreatment level. (c) Cumulative food intake. The number represents a sum of daily food intake over the 2 wks of leptin treatment. (d) Fasting blood insulin after the leptin treatment. (e) Fasting blood glucose after the leptin treatment. (f) MOHA-IR in ob/ob mice after the leptin treatment. The data are expressed as mean ± s.e. (n = 5–6). *P < 0.05, *P < 0.01, ***P < 0.001 vs sham by t-test.

