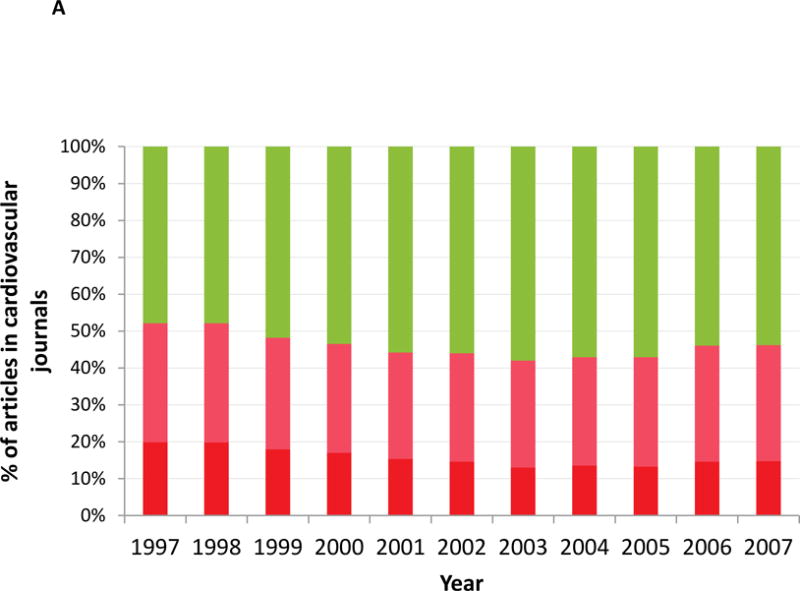
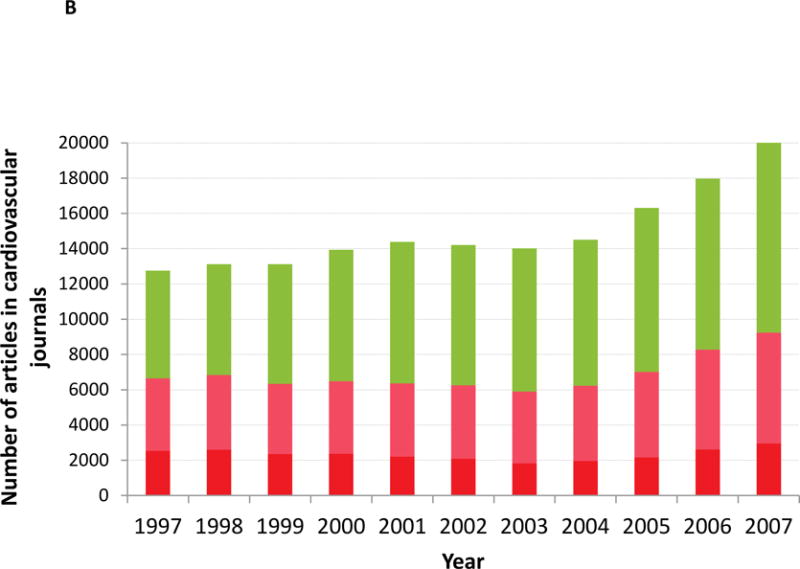
Figure 2.


Figure 2 shows the yearly trend in the proportion (2A) and absolute number (2B) of poorly cited and well cited articles from 1997–2007. The red bars indicate poorly cited articles with the darker red bars indicating the subset of uncited articles among the poorly cited articles. The green bars indicate well cited articles.
