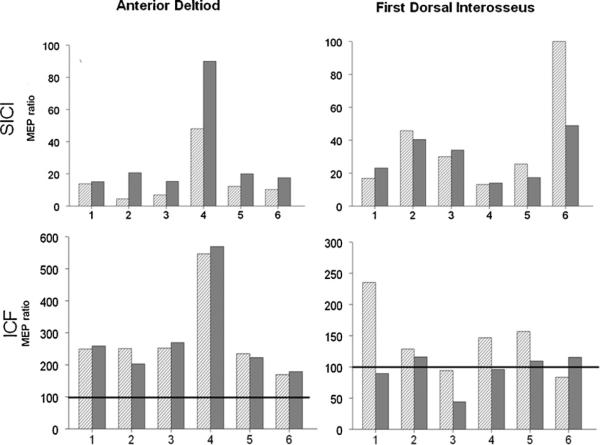
Fig. 4.
SICI and ICF: MEP ratio data for participants 1–6 in sitting (striped bar) and standing (solid gray bars). MEP ratio of 100 (dark horizontal line in the lower row) would indicate no effect of the conditioning stimulus. MEP ratio less than 100 indicates inhibition while MEP ratio of more than 100 indicates facilitation. For the AD muscle, the MEP ratio is consistently higher (indicating less inhibition) in standing compared to sitting (p = 0.06; effect size = 0.6).

