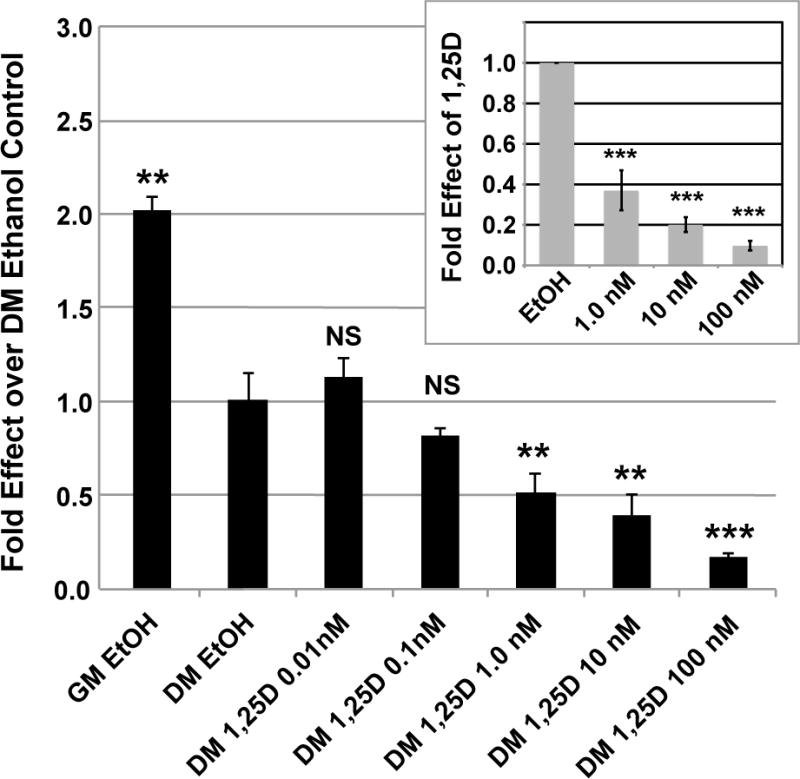
Figure 2. FGF23 mRNA repression by 1,25D in 3T3-L1 adipocytes.

3T3-L1 cells were grown as described in Methods and treated with 1,25D for 24 hours at the indicated concentrations. mRNA levels for FGF23 were determined by real-time PCR. GM is growth medium and DM is differentiation medium. Inset depicts the average of three independent experiments identical to that illustrated in the main body of the figure, except that only doses of 1, 10 and 100 nM 1,25D were tested. Each bar represents the average of three independent experiments performed in triplicate ± standard deviation. All statistics are calculated relative to the DM EtOH set at 1.0. ** p < 0.01, *** p < 0.001
