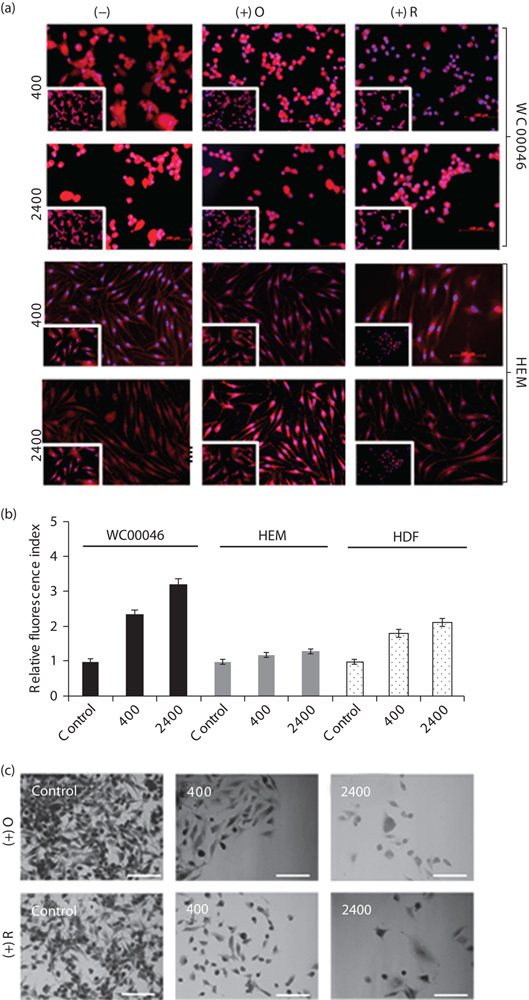
Fig. 3.

(a) WC00046 melanoma cells and normal HEM were pretreated with oligomycin or rotenone for 1 h and subsequently irradiated with 0.5 Gy at a dose rate of 400 or 2400 MU/min. At 7 days after radiation, the treated cells were stained with Mitotracker red fluorescent dyes to detect mitochondrial respiration, and florescence microscopy was used for imaging (20× magnification; scale bars indicate 100 µm). Nonirradiated control cells (insets) are shown for the individual radiation setting for each cell type. Each panel shows a representative fluorescent field from four separate experiments. (b) Average fluorescence intensity from five random fields for each experimental setting as described in (a) normalized against the average intensity of corresponding nonirradiated cells (black bars). Fold changes for 400 MU/min rate (white bars) and 2400 MU/min rate (grey bars), shown with standard error bars. (c) Cells as in (a) were stained with nuclear red and methylene blue, and morphology was visualized by bright field microscopy. HEM, human epidermal melanocytes.
