
Fig. 1.
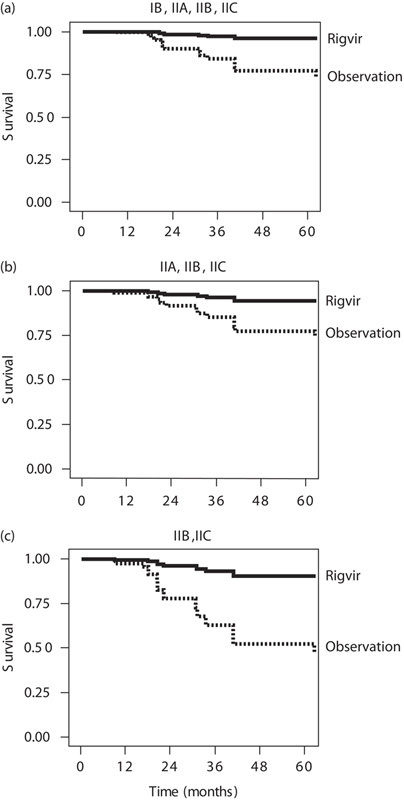
Cox regression analysis plots of survival of melanoma patients following surgery. P is the statistical significance of the difference between the Rigvir (—) group and the observation according to current guidelines (observation) group (---) after adjustment for age, sex and substage; hazard ratio (HR), 95% confidence interval (CI). (a) Substages IB, IIA, IIB, IIC, Rigvir (N=52), observation (N=27), P<0.005, HR=6.27 (CI: 1.75–22.43). (b) Substages II (A, B, C), Rigvir (N=35), observation (N=22), P<0.032, HR=4.39 (CI: 1.14–16.98). (c) Substages IIB and IIC, Rigvir (N=19), observation (N=17), P<0.014, HR=6.57 (CI: 1.47–29.46).