
FIG 3.
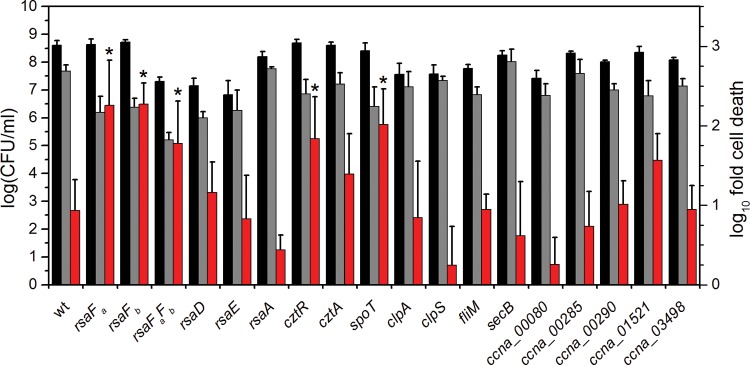
Comparison of U survival by mutants identified by Tn-seq. Strains were exposed to a no-U control (black bars) or 50 μM uranyl nitrate (gray bars) in 50 mM PIPES buffer at pH 7.0 for 1 h, after which CFU/ml were counted (left axis). Red bars represent the fold change in CFU/ml counts between the U condition and the control (right axis). Error bars represent standard deviations from at least four biological replicates. Mutants showing a lower U survival rate (i.e., higher susceptibility to U) than the wild type are highlighted with asterisks (*, P < 0.01).