
FIG 6.
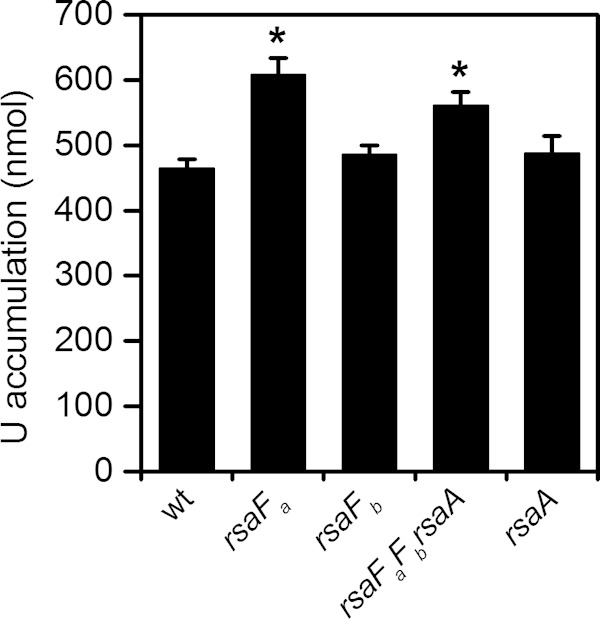
Comparison of U accumulation by wild type (wt) and rsaF mutants. Amounts represent U accumulated by 8 × 10⁷ cells after 1 h of U exposure in 50 mM PIPES buffer at pH 7.0. Error bars represent standard deviations from three biological replicates. Mutants showing higher U accumulation than that of the wild type are highlighted with asterisks (*, P < 0.002).