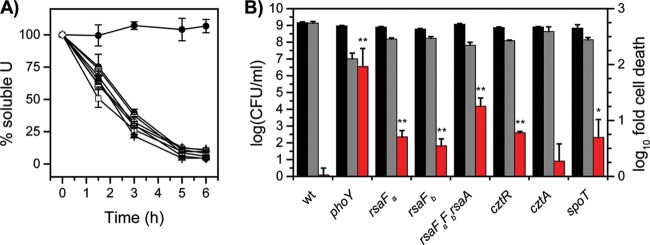
FIG 9.
Comparison of U biomineralization activity and cell survival of mutant strains under U-mineralizing conditions. (A) U biomineralization activity is shown for the wild type (■), phoY mutant (●), rsaFa mutant (▲), rsaFb mutant (◆), rsaFaFb rsaA triple mutant (□), cztR mutant (○), cztA mutant (△), and spoT mutant (♢). Error bars represent standard deviations from three biological replicates. (B) Cell survival under U-mineralizing conditions after 6 h of incubation. CFU/ml counts (left axis) at 0 h (black bars) and 6 h (gray bars) are shown. Fold change in CFU/ml counts between 0 and 6 h (red bars; right axis) is also shown. Mutants showing significantly higher susceptibility to U than the wild type are highlighted with asterisks (*, P < 0.03; **; P < 0.01).

