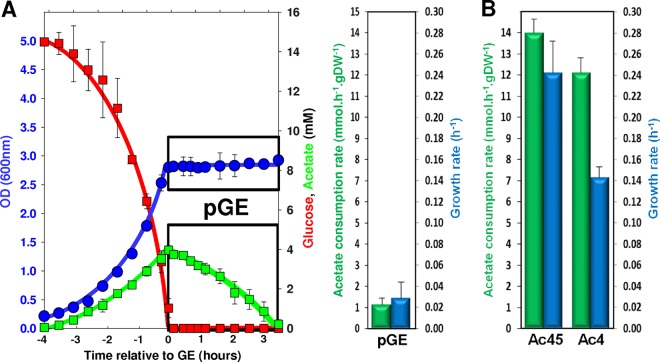
FIG 2.
Growth parameters after the glucose exhaustion in a glucose-acetate transition and during growth on acetate as sole carbon source. (A) Glucose, acetate, and biomass (OD) profiles of a culture performed in minimal M9 medium plus 15 mM glucose are shown on the left, with the period following glucose exhaustion boxed (pGE, post-glucose exhaustion). On the right, acetate consumption rates (millimoles of acetate consumed per hour and per gram of biomass [dry weight]) and the growth rate during the post-GE period are presented. (B) Acetate consumption rates and growth rates during growth on 45 mM acetate (Ac45) or 4 mM acetate (Ac4).

