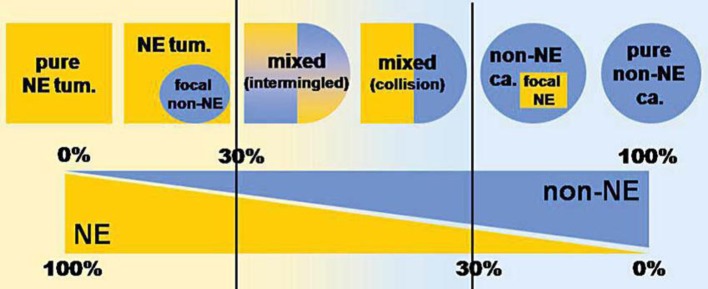
Fig. 3.
Schematic representation showing the wide spectrum of combinations of exocrine and neuroendocrine components in human tumors, ranging from neuroendocrine neoplasms with a focal exocrine component at one extreme (left) to exocrine carcinomas with interspersed neuroendocrine cells at the other (right). However, mixed exocrine-neuroendocrine tumors (middle) are only those neoplasms in which each component represents at least 30%percnt; of the lesion. NE = Neuroendocrine; tum. = tumor; ca. = carcinoma. Modified from Volante et al. [5].

