Figure. 4.
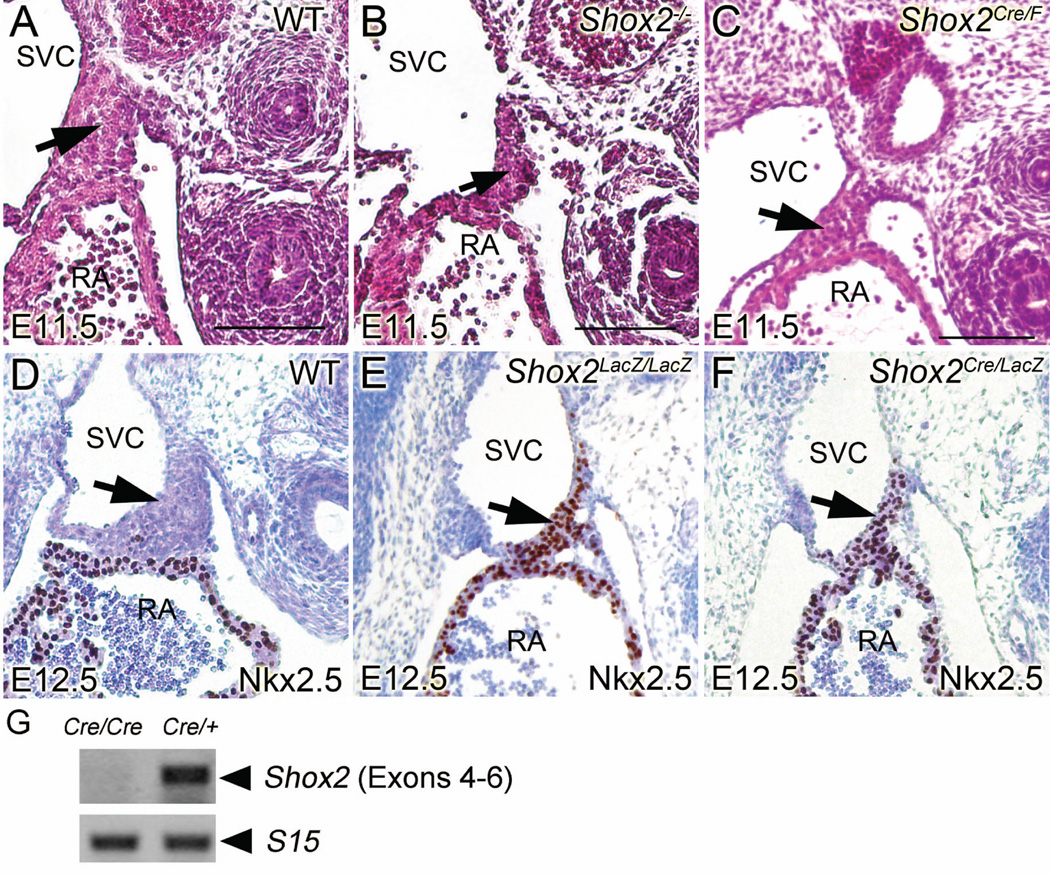
Similar hypoplasia phenotype was observed in the SAN of Shox2Cre/F, Shox2LacZ/LacZ and Shox2Cre/LacZ mice as seen in Shox2-null mice. (A–C) representative H&E staining pictures of the developing SAN in E11.5 WT (A), Shox2 conventional knockout (B) and Shox2Cre/F embryos(C). Arrows denote SAN region. (D–F) representative IHC pictures of the developing SAN in E11.5 WT (D), Shox2LacZ/LacZ (E) and Shox2Cre/LacZ embryos (F). Arrows denote SAN region. Note the ectopic expression of Nkx2.5 in the SAN region of Shox2LacZ/LacZ and Shox2Cre/LacZ embryos. (G) RT-PCR assays demonstrating the absence of Shox2 transcript in E11.5 Shox2Cre/Cre mice. Scale bar: 100 µm.

