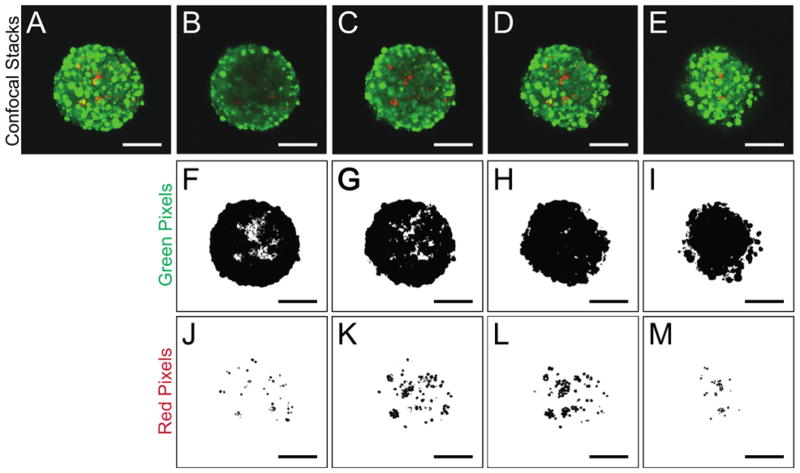
Figure 2. Determination of spatial distribution of microparticles.
(A–E) Z-Projections of confocal images of cell-microparticle aggregates. MIN6 β-cells are stained with a CellTracker dye and appear green while laminin-coated microparticles appear red. (A) Entire cell-microparticle aggregate (~100 μm). (B–E) Smaller z-projection stacks taken throughout the z-dimension of the cell-microparticle aggregates starting at the bottom (B) and progressing upward to the top of the aggregate (E). (F–I) Green pixels (cells) in each stack. (J–M) Red pixels (microparticles) imaged in each corresponding stack. The red and green pixels detected in J–M and F–I, respectively, are used to determine total microparticle incorporation and spatial distribution of the microparticles throughout the z-direction. Scale bars represent 50 μm. Note: For image analysis done, a total of 10 z-projection stacks, each representing 10 μm, were analyzed for each aggregate. Four example stacks are shown here for clarity.

