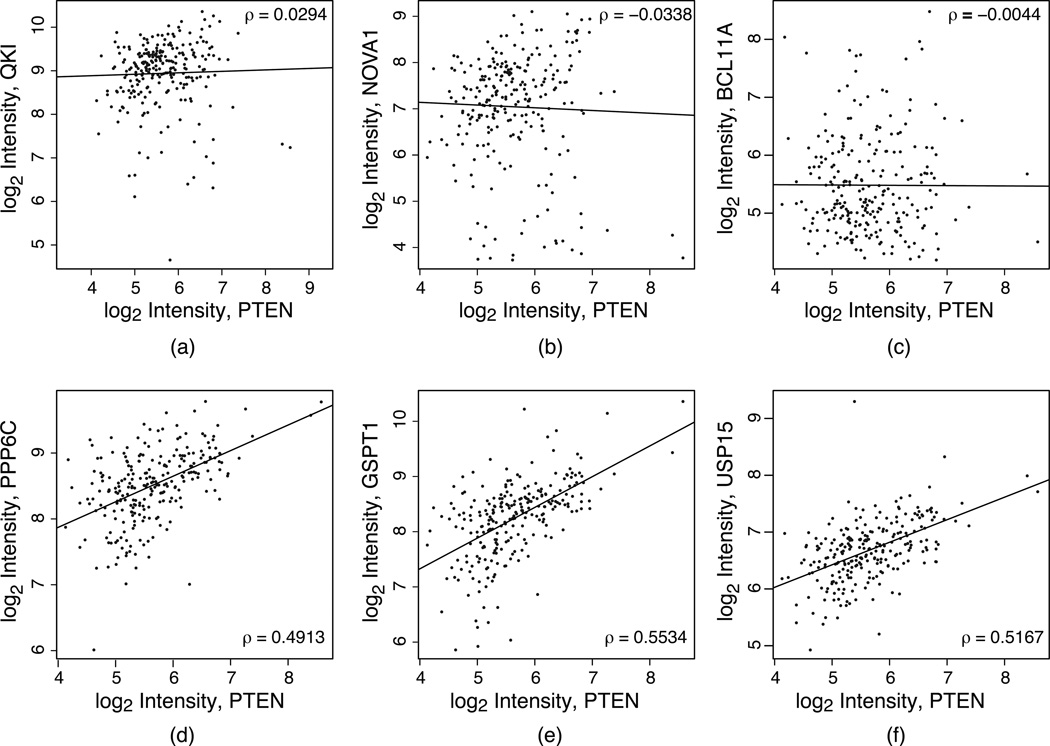
Figure 3.
Expression scatter plots of PTEN vs. top predicted ceRNAs in GBM. (a)–(c) The three genes were top ranked ceRNAs predicted by sequence-pairing listed in Table 3a. However, their gene expression correlations to GOI (PTEN) are low and insignificant. Consequently, they were not among the top ranked ceRNAs after considering co-expression with PTEN (see Table 3b). (d)–(e) Three top ranked GBM-specific ceRNAs predicted by sequence-pairing and co-expression test (Table 3b). Clearly, their higher correlation coefficients enhance their prediction p-values.

