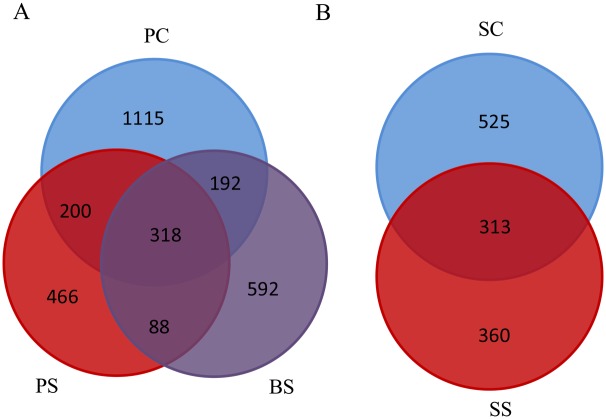
Fig 4. Venn diagram of the number of OTUs common/unique to the black stain and control groups.
The overlapping areas represent the number of OTUs shared by the counterpart samples. A: A total of 2971 OTUs were detected in black stain (BS) and the dental plaque of the black stain group (PS) and control group (PC). Only 318 OTUs were shared by PS, PC and BS, while 1115, 466, and 592 OTUs were unique to the respective groups. B: A total of 1198 OTUs were detected in the salivary samples of the black stain group (SS) and control group (SC). Only 313 OTUs were shared by the SC and SS groups, and 525 and 360 OTUs were unique to the respective groups.

