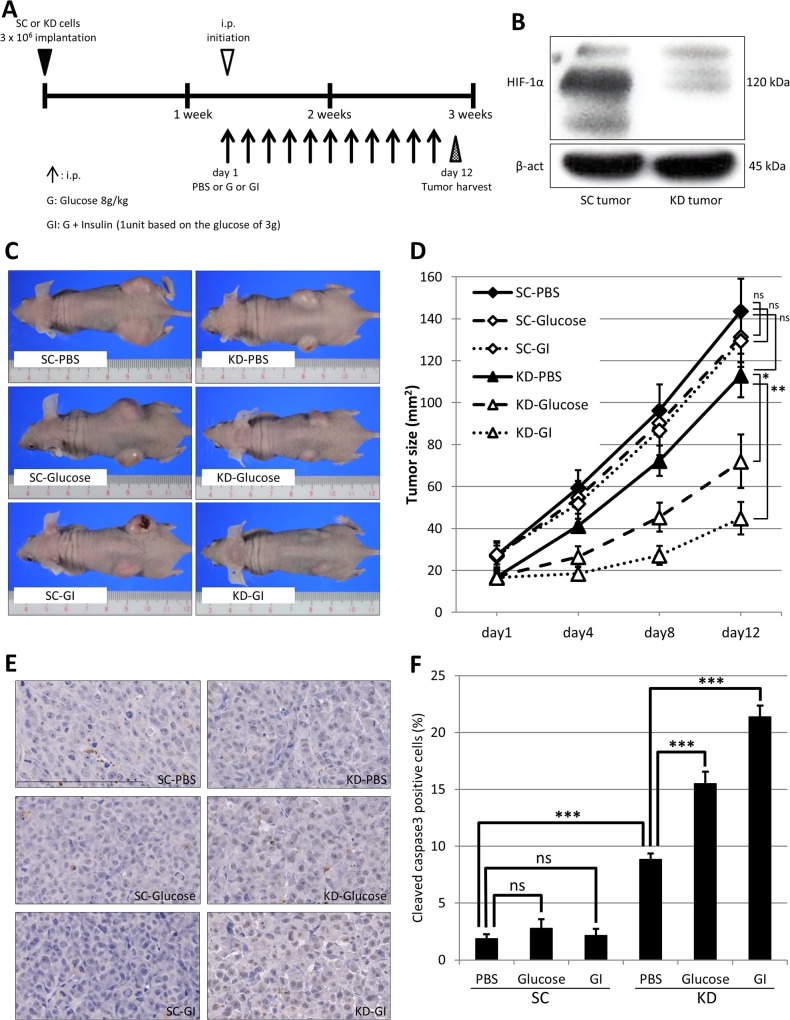
Fig 6. The in vivo effect of HIF-1αknockdown plus GI treatment on tumor xenografts.
(A) The experimental schedule of glucose (G) or glucose plus insulin (GI) treatment on the tumor xenografts. The initial intraperitoneal (i.p) injection with control PBS or Glucose, GI is indicated by the empty triangle. The i.p injections are indicated by arrows. The tumors harvested on day 12 are indicated by the reticulated triangle. (B) The Western blot analysis of HIF-1α in the xenografts of the SC cells (SC tumor) and KD cells (KD tumor). (C) Representative images of the SC or KD tumors treated with PBS, Glucose or GI. The treated tumors were designated as SC-PBS, SC-Glucose, SC-GI, KD-PBS, KD-Glucose and KD-GI. (D) The size of the 6 tumors on day 1 to day 12 was plotted on the graph as indicated. (E) The immunohistochemical analysis of cleaved caspase 3 was performed using six tumors of SC-PBS, SC-Glucose, SC-GI, KD-PBS, KD-Glucose and KD-GI. (F) The mean positive rate of cleaved caspase 3 in 6 tumors was estimated and presented in the graph. ns: not significant, *: p<0.05, **: p<0.01, ***: p<0.001.

