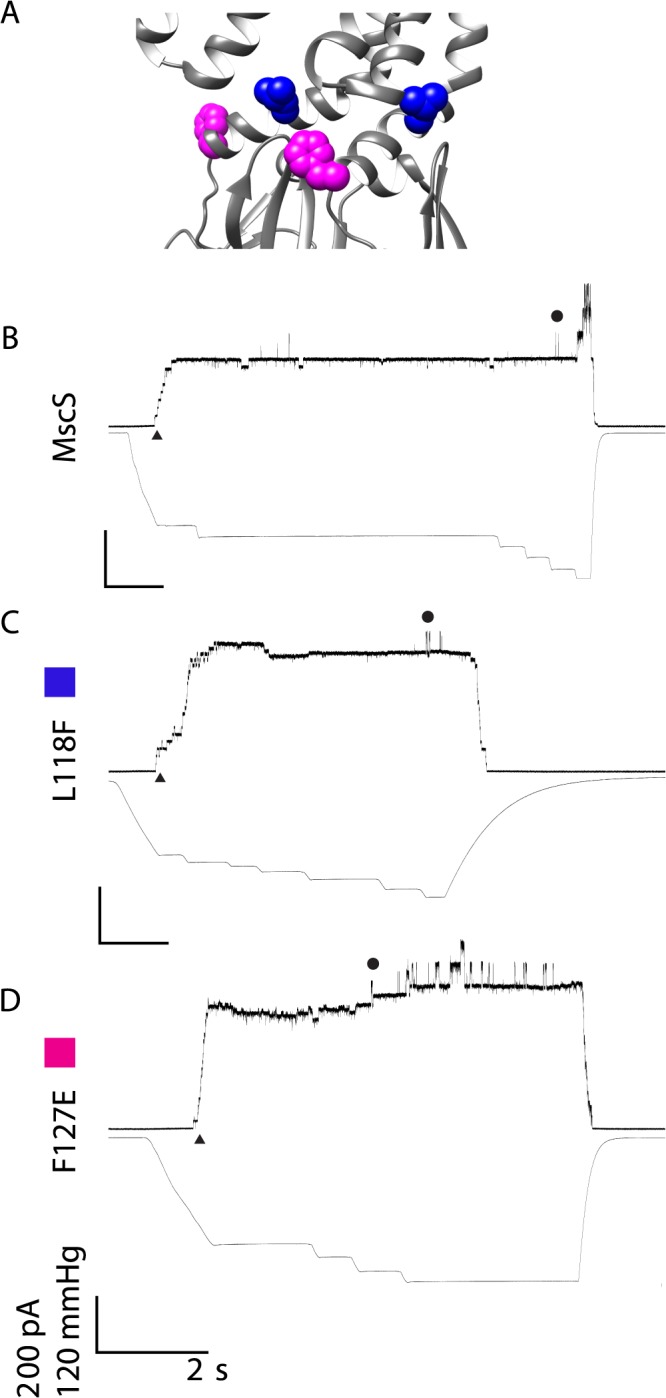
Fig 3. Representative traces are shown for wildtype MscS and mutated channels that show kinetically wildtype behavior.

A) Structural Representation of residues of interest B) Wildtype MscS C) L118F D) F127E The representative traces show the kinetic phenotype observed for the mutated channels in all patches from at least two independent spheroplast preparations. For simplicity, channel openings are shown as upward inflections, MscS openings are indicated by ▲ and MscL openings are indicated with ●. Scale bars represent 2 seconds on the X-axis and 200 pA and 120 mmHg on the Y-axis. Traces are labeled with a color box corresponding to the color in the structural representation for clarity.
