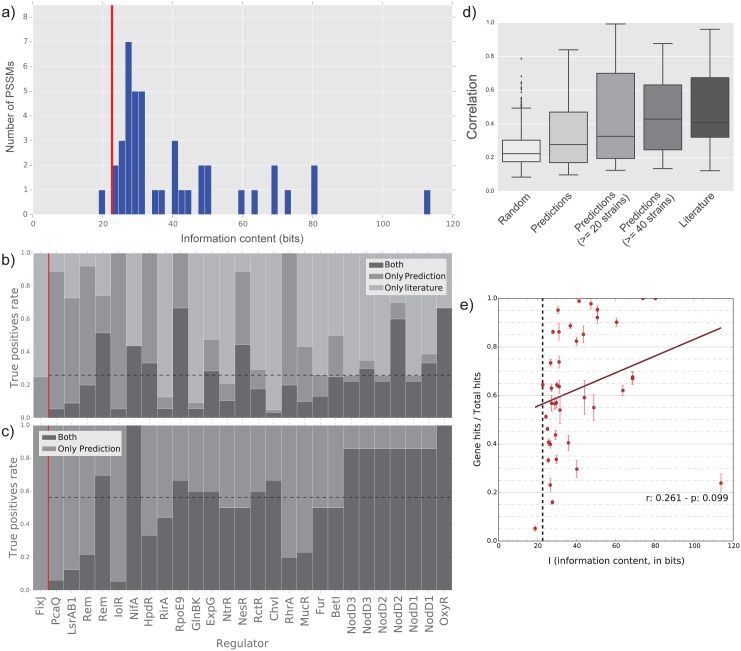
Fig 1. General characteristics of the presented TF predictions and quality control.
a) Information content frequencies for the 41 analysed TFs: vertical line indicates the minimum information content, as measured for S. meliloti strain Rm1021; b-c) comparison between TFBS predictions and the reported experimental results in strain Rm1021: the dashed horizontal line indicates the mean value for the TFs with information content higher than the minimum value; d) correlations with the COLOMBOS expression compendium for S. meliloti Rm1021; e) correlation between the TFs information content and the signal-to-noise ratio, measured as the proportion of prediction in genes upstream regions over the total number of predictions: vertical bars indicate the error level measured in all the strains.

