
Fig 3. Correlations between pangenome diversity and regulatory network distances.
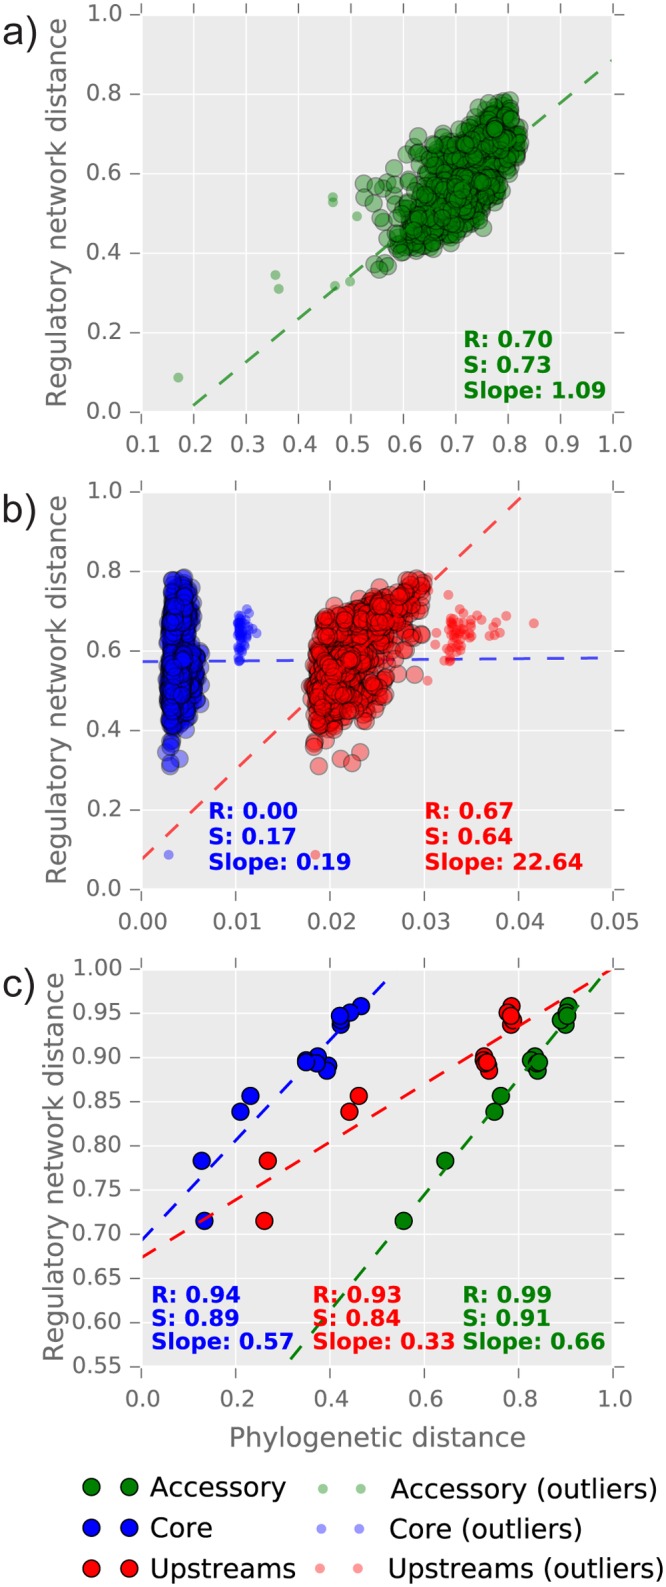
R and S indicate the Pearson’s and Spearman’s correlation coefficients between the regulatory network and each pangenome partition distances (see Materials and Methods for the definition of the distances metrics used here). Outliers have been defined using a Z-score threshold of 3.5 on the mean absolute deviation of the distances. a) correlations within the S. meliloti species for the accessory genome; b) correlations within the S. meliloti species for coding and upstream regions; and c) correlation between the outgroups.