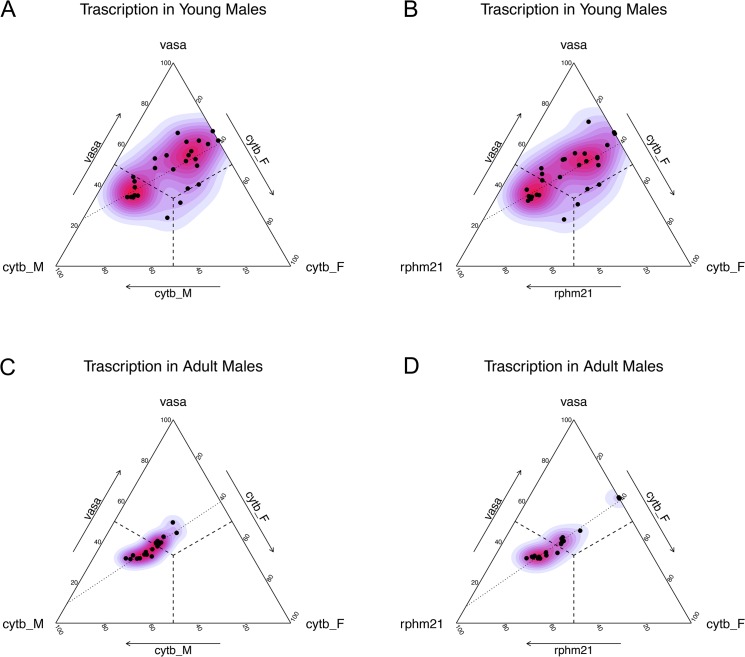
Fig 3. Transcription level in juvenile (A, B) and adult (C, D) males.
(A) Transcription of vasph, cytb_M and cytb_F in young males. (B) Transcription of vasph, rphm21 and cytb_F in young males. (C) Transcription of vasph, cytb_M and cytb_F in adult males. (D) Transcription of vasph, rphm21 and cytb_F in adult males. Color gradient: kernel density estimation of the distribution. Dashed lines: middle segments representing equal transcription of the targets indicated at the vertexes of the orthogonal side. The three middle segments meet in the barycenter (i.e. the point of equal transcription of the three targets). Dotted lines: smoothed conditional mean of the distribution.

