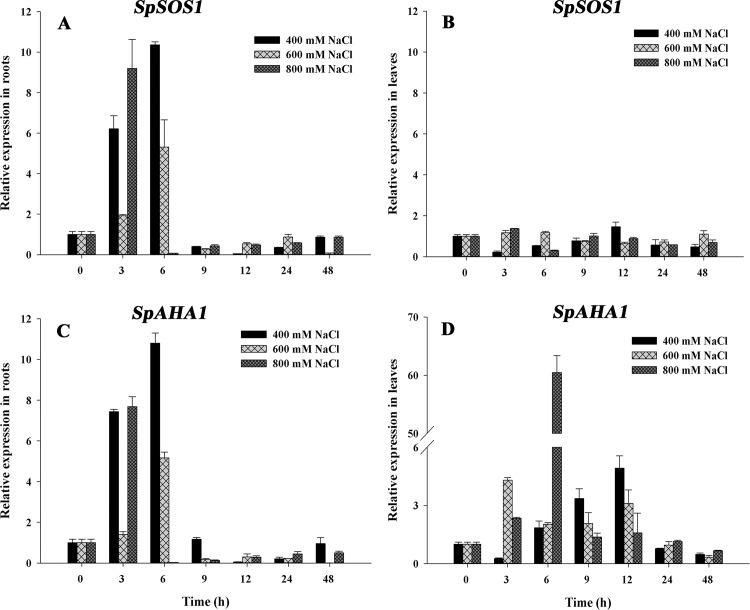
Fig 3. Changes in SpSOS1 and SpAHA1 mRNAs in S. portulacastrum exposed to salinity.
Seedlings were treated with 400, 600 or 800 mM NaCl. The expression of SpSOS1 (A, B) and SpAHA1 (C, D) was analyzed in roots (A, C) and leaves (B, D) at different time intervals (0, 3, 6, 9, 12, 24 and 48 h) under salt treatment using real-time PCR. The expression value at the initial time (0 h) was set to 1, and the expression levels at the other time points under salinity treatment were calculated as the fold of the value at 0 h. Values are expressed as the means±SE (n = 3).

