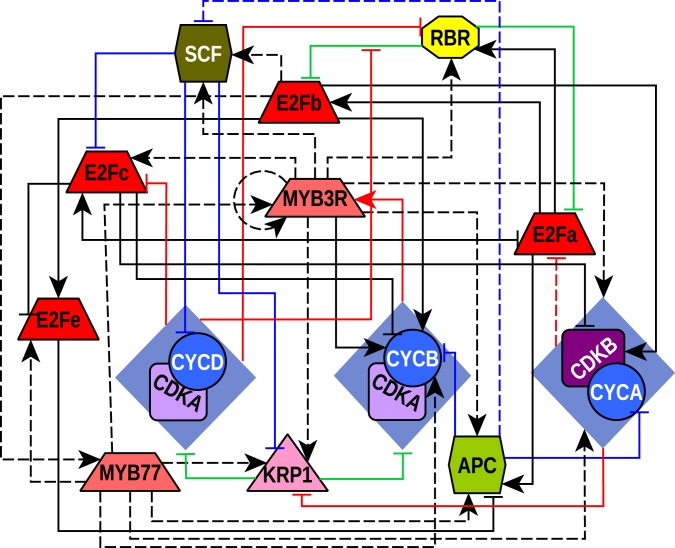
Fig 1. Regulatory network of the A. thaliana CC.
The network topology depicts the proteins included in the model as well as the relationship among them. Nodes are proteins or complexes of proteins and edges stand for the existing types of relationships among nodes. The trapezoid nodes are transcription factors, the circles are cyclins, the squares are CDKs, the triangle represent stoichiometric CDK inhibitor, the hexagons are E3-ubiquitin ligase complexes and the octagon is a negative regulator of E2F proteins. Edges with arrow heads are positive regulations and edges with flat ends illustrate negative regulations. The red edges indicate regulation by phosphorylation while blue ones indicate ubiquitination, the green ones show physical protein-protein interactions and the black edges transcriptional regulation. Only CDK-cyclin interactions are not represented with a line. Interactions to or from rhombuses stand for interactions that involve the CDK as well as the cyclin. A solid line indicates that there is experimental evidence to support such interaction and dotted lines represent proposed interactions grounded on evidence from other organisms or in silico analysis.

