
Fig 3. Attractor robustness analysis.
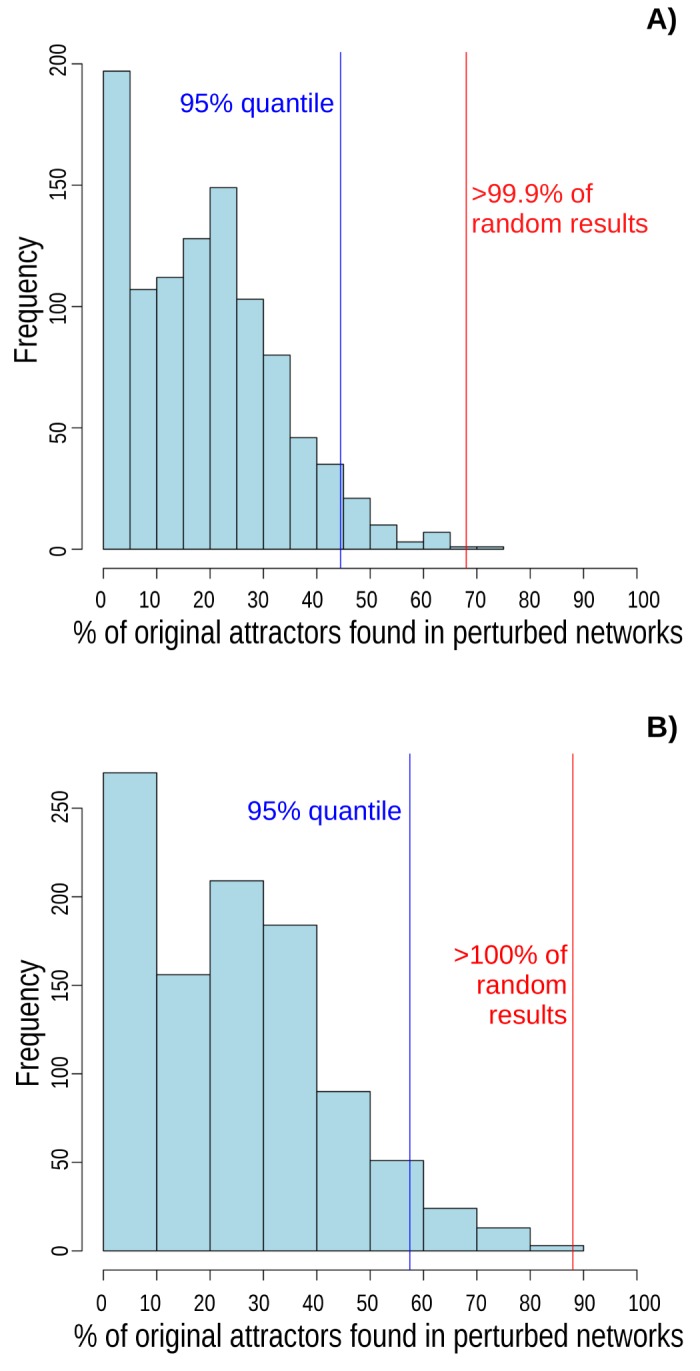
Random networks with similar structure to A. thaliana CC GRN were less tolerant to perturbations than original CC GRN. The frequency of perturbations that recovered the original attractor after a perturbation in the Boolean functions, is shown in: (A), where the red line indicates that A. thaliana CC GRN recovers its original attractor in 68% of perturbations (the median of random networks was 18.55% and mean 19.12% ± 13.86 SD). When transitions between network configurations are perturbed (B), A. thaliana CC GRN recovers its original attractor in 88% (vertical red line) of perturbations, while the median of random networks that recover the original attractor was 24.2% (mean 24.6% ± 18.2 SD). Vertical blue line indicates the 95% quantile. 1000 random networks were analyzed.