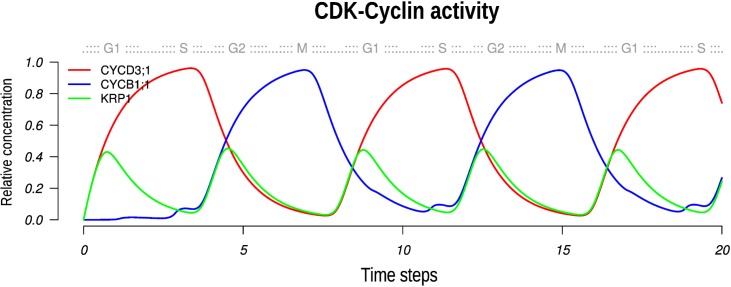
Fig 4. Continuous version of the A. thaliana CC Boolean model.
In this graph we show the activity of the CDKA;1-CYCD3;1 and the CDKA;1-CYCB1;1 complexes as a function of the amount of cyclins, and KRP1 inhibitor. The CDK-cyclin activity is the limiting factor to pass the G1/S and the G2/M checkpoints. A little more than two complete CC are shown (upper horizontal axis) to confirm that oscillations are maintained.

