
Figure 2.
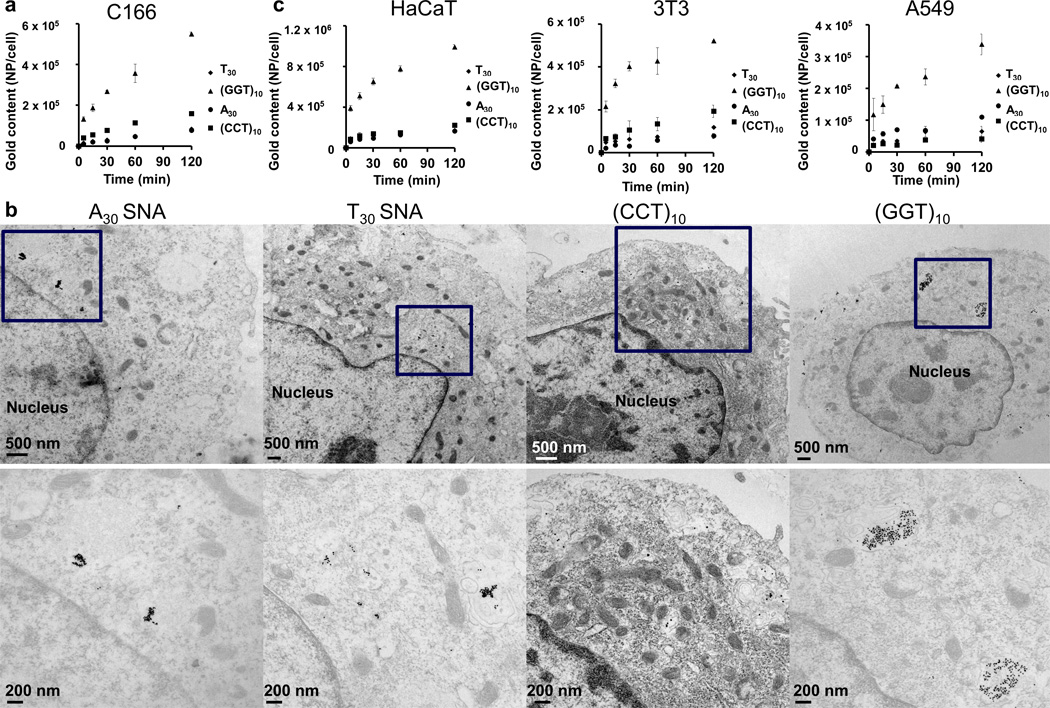
Cellular uptake of SNAs. a) Poly G SNAs show the highest association with C166 cells, 4–10 times higher than SNAs composed of other nucleobase types (p < 0.001). b) By TEM imaging, poly G SNAs exhibit the highest accumulation inside C166 cells, as evidenced by their widespread distribution throughout the cytosol as large clusters (>100 per clusters). By contrast, SNAs composed of other nucleobase types either accumulate in more confined regions of the cytosol or appear in clusters that contain fewer particles (<20 particles per cluster). The bottom row features enlarged images of the boxed regions of the top row. c) Poly G SNAs also demonstrate the highest association with three other cell lines beside C166, including, in descending order of expression level for SR-A, HaCaT (immortal human keratinocyte), 3T3 (mouse fibroblast), and A549 (human lung epithelial adenocarcinoma). For all cell types, poly G SNAs exhibit 3–5 times higher association with cells than SNAs of other nucleobase types (p < 0.001). Association of poly G SNAs with cells positively correlates with the expression level of SR-A for the same cell types. Error bars denote the standard deviation from triplicate measurements.