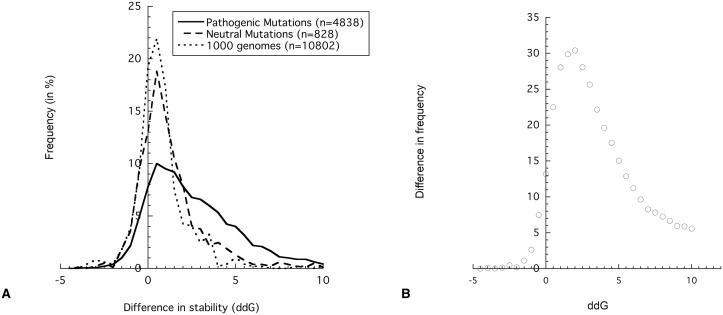
Fig 2. Effect of mutations on protein stability.
A) Histogram for the efffect of stability (ΔΔG) for i) the pathogenic dataset, ii) the neutral dataset and iii) SNPs identified in the 1000 genomes project. A negative ΔΔG indicates a stabilizing mutation, whereas a positive ΔΔG indicates that the mutation disturbs the protein stability. B) Enrichment of pathogenic mutations based on ΔΔG. The difference in the frequency of pathogenic mutation and neutral mutations is plotted for each ΔΔG interval, where a positive value indicates an enrichment of disease mutations.

