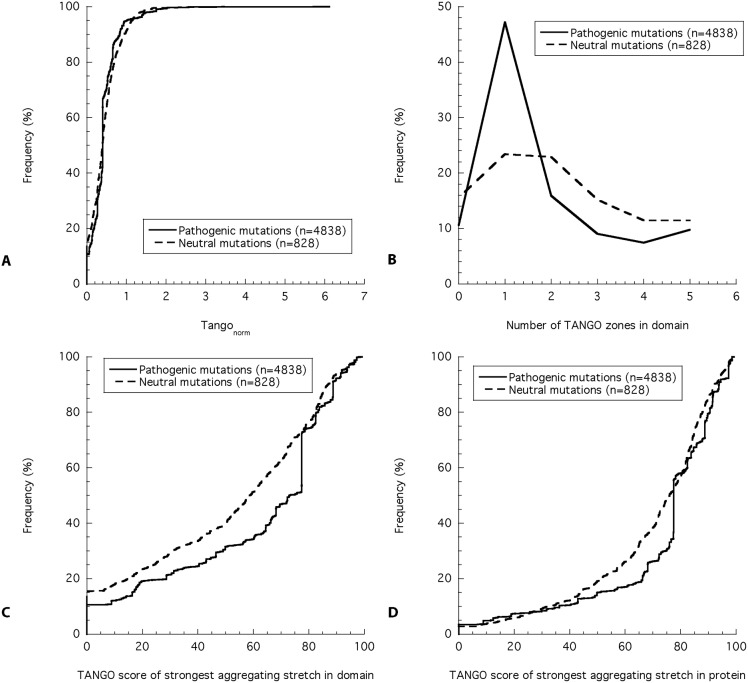
Fig 3. Analysis of the aggregation propensity in structural domains.
The A) normalized TANGO score, B) number of aggregating stretches, and C) score of the strongest aggregating stretch in the structural domain with the non-synonymous mutation (pathogenic or neutral) represented as cumulative frequency (A, C) or frequency (B) plot. (D) Cumulative frequency plot of the score of the strongest aggregating stretch in the complete protein.

