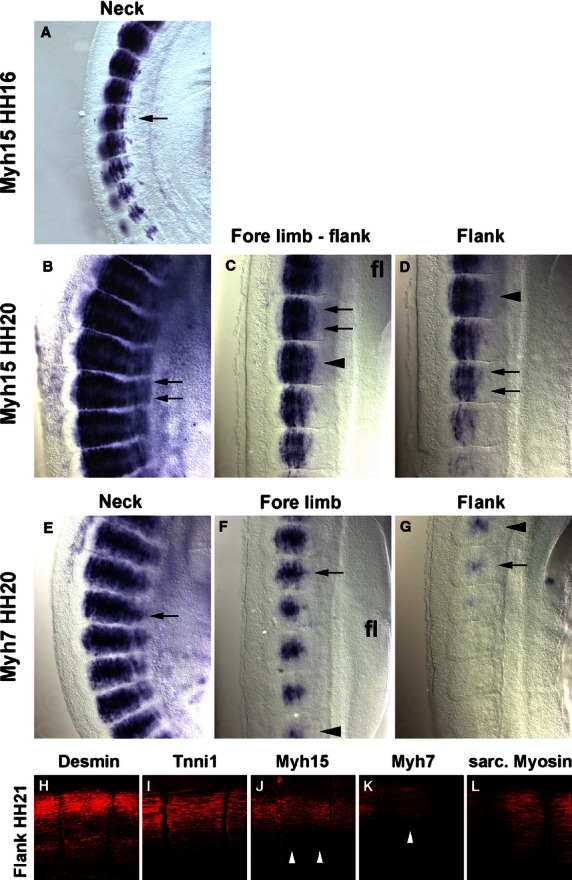
Fig. 7.

Comparison of Myh15 and Myh7 expression at HH16, 20 and 21. (A–D) Myh15 mRNA expression in the somites of the HH16 neck (A) and the HH20 neck (B), fore limb-flank border (C) and the flank (D). (E–G) Myh7 mRNA expression in the HH20 neck (E), at fore limb levels (F) and in the flank (G). Anterior is to the top in all, dorsal to the left. Arrowheads mark the same somites in (C,D) and (F,G), respectively. Note that at HH16, Myh15 expression is strongest in the centre of the developing myotubes; at HH20, expression is strongest at the rostro-caudal ends (arrows), whereas Myh7 labels the centres of the myotubes (arrows). (H–L) Flattened confocal z-stacks of HH21 flank somites, stained with antibodies detecting the proteins indicated on the top of the panel. Lateral views, dorsal to the top, anterior to the right. Note that Myh15 protein accumulated more strongly along the rostro-caudal edges of the myotome, whereas Myh7 protein is more concentrated in the centre (arrowheads). Annotations as before.
