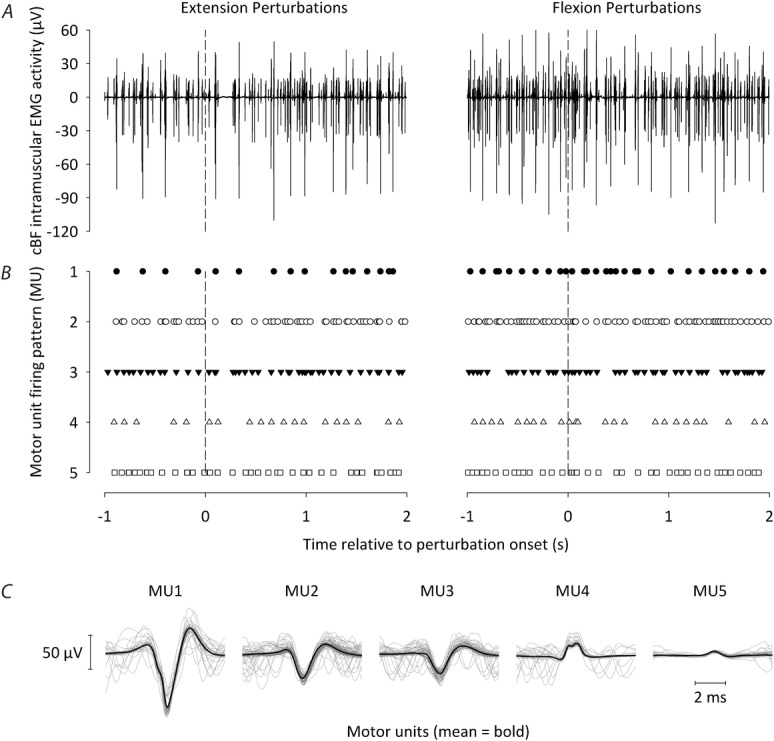
Figure 4. Motor unit decomposition.

A, raw i.m. EMG data recorded from the cBF following one flexion (left) and one extension (right) iKnee joint rotation trial from one participant. B, firing pattern of the five different motor units that were identified during decomposition for the corresponding raw data in (A). The vertical dashed lines indicate iKnee flexion or extension perturbation onset. C, mean templates of the five different motor units that were identified during decomposition (thick black lines), together with each of the separate instances or each motor unit firing (thin grey lines). Note that the same five motor units were identified during decomposition following both iKnee flexion and extension joint rotations.
