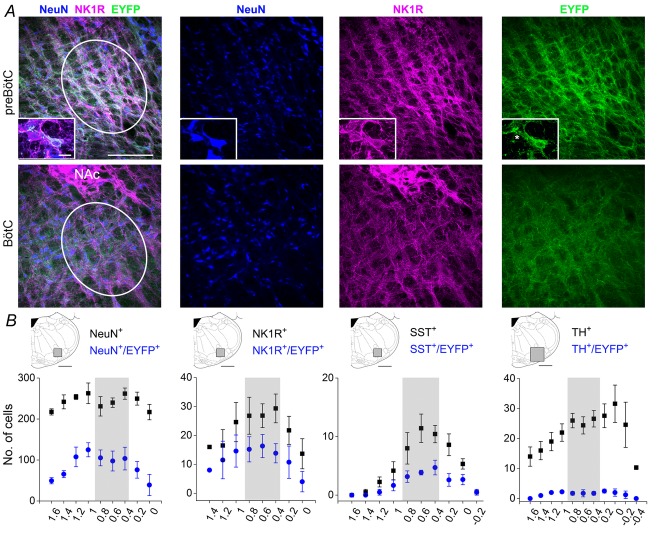
Figure 1. Distribution of EYFP labelled neurons along the rostrocaudal extension of the ventral respiratory column.
A, three-colour confocal mosaics (left) and single-colour images (right) showing co-localization of NeuN (blue), NK1R (magenta) and EYFP (green) in transverse sections taken at the level of the preBötC (top) and BötC (bottom). Inset displays two NK1R positive neurons, one expressing EYFP and one lacking EYFP expression (asterisk). B, rostrocaudal (right–left) distribution of total NeuN+ and NeuN+/EYFP+ neurons, NK1R+ and NK1R+/EYFP+ neurons, SST+ and SST+/EYFP+ and TH+ and TH+/EYFP+ neurons after unilateral injection of SYN-ChR2-EYFP virus into the preBötC. Diagrams above plots illustrate the area (grey zone) where cell counts were performed. On the x-axis of plots the distance (in mm) from the caudal tip of the facial nucleus is indicated. Grey zone in plots indicate the area of high density of SST+ and NK1+ neurons corresponding to preBötC. Calibration bars in A: main panels, 200 μm; insets, 20 μm.

