
Figure 6. Photostimulation of SYN-ChR2-EYFP-treated rats in the preBötC generates respiratory reset.
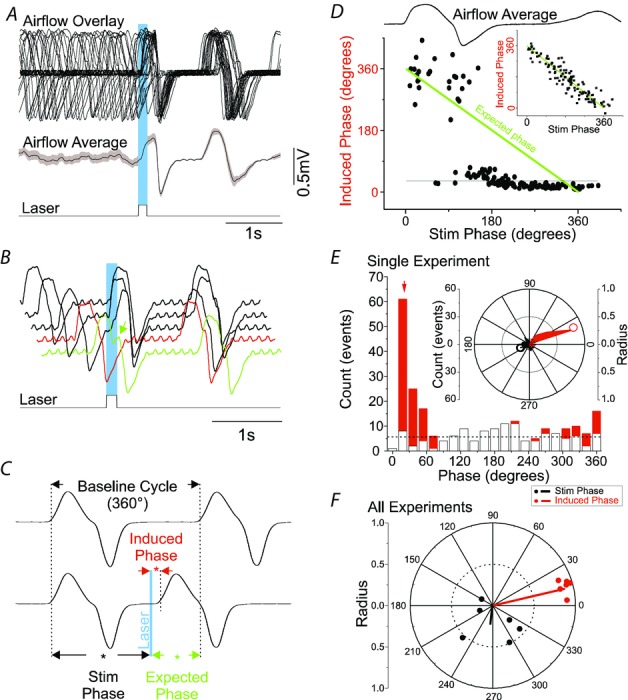
A, superposition of respiratory airflow traces (top, n = 27) and average airflow trace (centre) during 150 ms pulse photostimulation (bottom), which resets and aligns the subsequent inspiratory event. The greyed area behind the dotted line on average airflow trace indicates the standard error of the mean. B, overlay of five respiratory airflow traces from the same experiment in A arranged by the phase of stimulus delivered during ongoing respiration. The red trace indicates a lack of immediate response to photostimulation when it occurs during the post-inspiratory phase (refractory period). The green trace shows a slight prolongation of inspiration (green arrow) when the stimulus is delivered during the inspiratory phase. C, calculation of phase perturbations by laser photostimulation. Top trace: baseline respiratory flow cycle (from 0 to 360 deg, measured from the onset of one inspiration to the next, see arrows). Bottom trace: respiratory flow cycle during stimulation. Stimulus phase: onset of photostimulation with respect to the phase of respiration (black asterisk and arrows); induced phase: onset of inspiration subsequent to delivery of photostimulation (red asterisk and arrows); expected phase: expected onset of the next inspiratory cycle with respect to stimulus onset if photostimulation had no effect (360 deg minus stimulus phase; green asterisk and arrows). D, average respiratory flow (top) and distribution of induced phases as a function of stimulus phase (bottom). The expected phase is shown as a green line which assumes that the subsequent phase in the absence of stimulation will occur at 360 deg from the onset of respiration (see inset for non-stimulated case). Horizontal line indicates the average induced phase for the major short latency cluster (at 30 deg) occurring for stimulus phases beyond ∼90 deg. Note, however, another prominent cluster at longer induced latencies at ∼330 deg that occurred for stimulus phases shorter than ∼90 deg. E, distribution of events for stimulus and induced phases during multiple trials of 125 ms photostimulation delivered during the same experiment as shown in A. While stimuli were distributed in a near-uniform fashion randomly across all phases of respiration (open bars), the stimulus-induced phase values (red bars) demonstrated clustering at a tight range of preferred phase angles. The red arrow indicates the average angle for the distribution of induced phases (21 deg). The horizontal dotted line indicates the expected value of both distributions across phases based on an average random assignment. These data are also plotted in polar form in the inset with stimulus phase as a black fill and induced phase as a red fill. Left scale bar indicates radial distance for number of events (0–60) for both stimulus and induced phase with divisions indicated by concentric circles on the plot itself. Innermost concentric circle represents the average expected value of the distribution similarly to the histogram representation. The average preferred angle and radius for both the stimulus and the induced phase is overlaid as an open dot (black and red, respectively). Right scale bar indicates normalized radial length for this average vector (0–1 with divisions again indicated by concentric circles on plot). Radial values close to 1 (represented by external circle) are indicative of low dispersion of angles and significant phase preferences in polar distributions. Note the marked difference of average radii between stimulus and induced phases. F, distribution of preferred phases of stimulus-induced respiration for six separate experiments at the same stimulus duration (vector end-points plotted as dots) and the calculated grand average vectors (plotted as lines) across all experiments (stimulus phase in black, induced phase in red). Note the tight similarity of clustering in induced (but not stimulus) phase angles across experiments.