
Figure 2. Processing of spike-triggered averages and determination of motor unit distribution size.
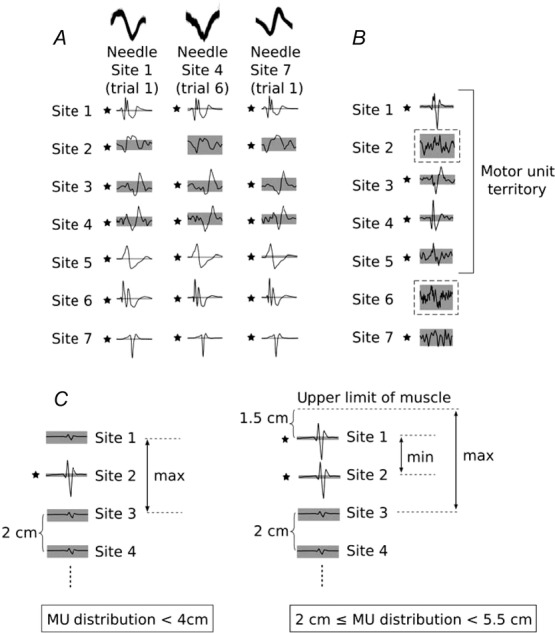
A, the same motor unit (MU) was recorded from all three intramuscular microelectrodes. Note the difference in action potential shape between microelectrode recordings (overlayed top traces). When we consider the spike-triggered averages from the seven fine-wire recording sites, it becomes clear that this is the same MU. B, two gaps (dashed boxes) where action potentials did not cross the ± 4SD threshold are present amongst other spike-triggered averages that crossed threshold. The gap at Site 2 is situated between two spike-triggered averages with clear action potentials associated with the target MU that crossed threshold. The gap at Site 6 is situated between a spike-triggered average with a clear action potential that crossed threshold (Site 5) and another spike-triggered average that crossed threshold, but did not have a clear action potential (Site 7). In this instance, the MU distribution was determined as Site 1 to Site 5. C, schematic representation of an MU with spike-triggered averages that crossed threshold at a single fine-wire electrode site (left) and an MU with spike-triggered averages that crossed threshold at two fine-wire electrode sites (right). Given an interelectrode distance of 2 cm and a distance between Site 1 and the edge of muscle, we can identify the maximum distribution for the MU on the left and the range for the MU on the right. The grey area indicates ± 4SD of baseline; *an action potential crossed the threshold value.