
Figure 5. Effects of 5–6 days of IL-1β exposure on IBa in medium-diameter DRG neurons.
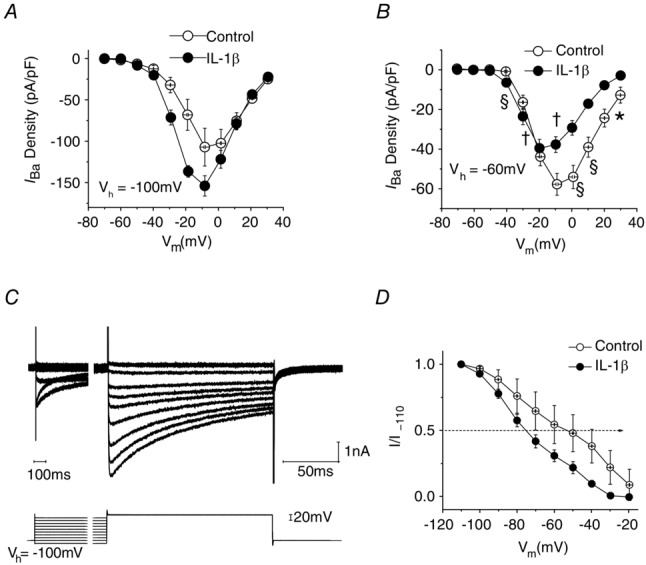
A, I–V plot shows that IL-1β exposure results in a slight increase in average IBa density in neurons studied from Vh = −100 mV. B, by contrast, when Vh = −60 mV I–V plots reveal a significant reduction in averaged IBa peak density (Vcmd = −10 mV) in neurons exposed to IL-1β (from −58 ± 6 pA pF−1, n = 10 to −38 ± 4 pA pF−1, n = 11; P < 0.01). C, representative traces illustrating currents and voltage protocols used to determine voltage dependence of inactivation. D, single Boltzmann function fitting of curves for the voltage dependence of inactivation reveal that IL-1β exposure led to a significant leftward shift (hyperpolarizing shift in IBa inactivation) in the values for V1/2 (illustrated by dotted line with arrowhead), whereas slope factor was unaffected. Error bars indicate means ± SEM. Significant difference versus control *P < 0.05, †P < 0.01 and §P < 0.001 with unpaired t test.