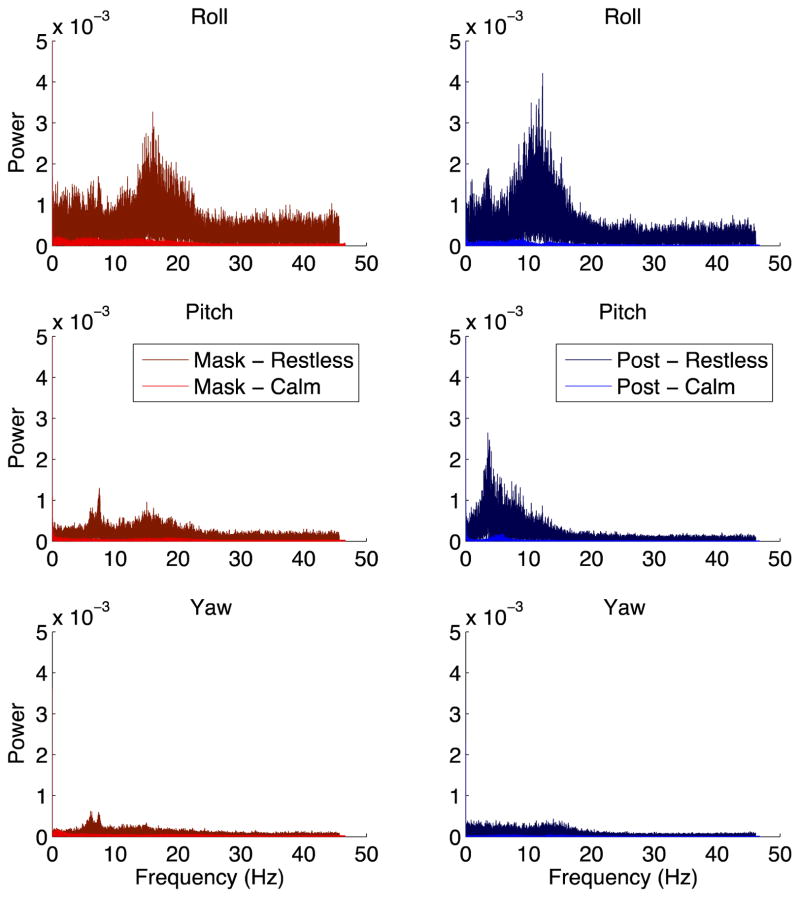
Figure 6. Power spectra of head movement.
Following a fast Fourier transformation, the power spectra of head rotational velocity in each of the three axes – roll (top), pitch (middle), and yaw (bottom) – is shown for two mask monkeys (left column), one calm (brighter color) and one restless (darker color), and two post monkeys (right column), one calm and one restless. These plots represent the same data as in Figure 5.

