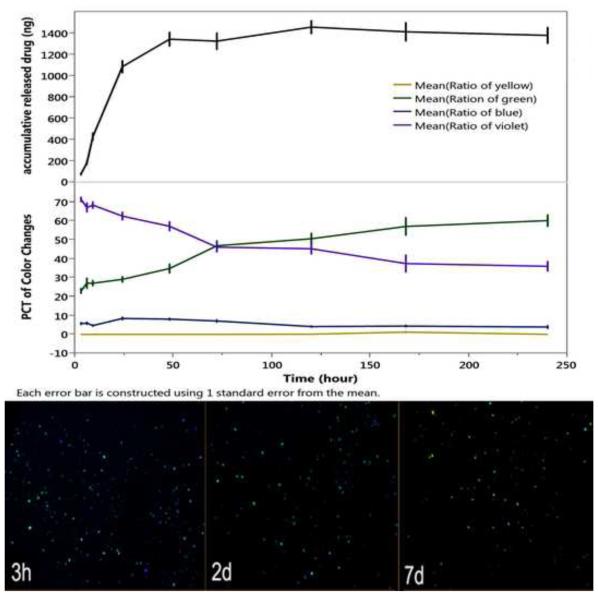
Figure 1.
Drug released and evolution of color classes as a function of time in HBSS at 37 °C for the 2.45-inf-RAP particle type. The green color component slowly increases while the violet component slowly decreases. Each color class is normalized such that the total color in all channels sums to 100% for each time point. The drug leaches out of the formulation more rapidly than the color changes. Each error bar is constructed using 1 standard error from the mean. Bottom images show the camera images obtained at the indicated time points. Samples are in a petri dish and imaged against a solid black background.

