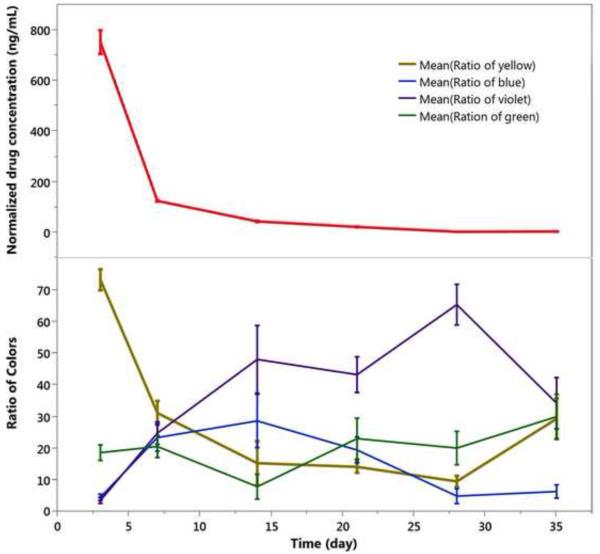
Figure 10.
Drug released and evolution of color classes as a function of time in vivo for the 2.17-cov-DEX particle type injected into rabbit eyes at day 0. Each color class is normalized such that the total color in all channels sums to 100% for each time point. Each data point represents three rabbits, which were sacrificed at the indicated time points to obtain drug concentration. Particle colors was shifted from yellow to violet during the 5-week observation period. Each error bar is constructed using 1 standard error from the mean.

