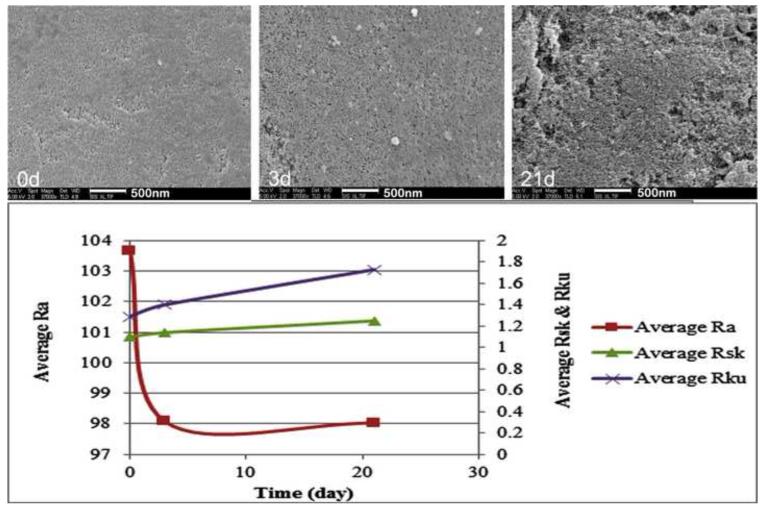
Figure 3.
SEM images and roughness analysis of the 2.45-inf-RAP particles measured ex-situ during the course of an in vitro drug release experiment (HBSS, 37 °C). Ra: Arithmetical mean deviation of the roughness profile; Rsk: Skewness of the roughness profile; Rku: Kurtosis of the roughness profile. The 21-day image demonstrated obvious pSi erosion compared with 0-day samples. Due to the unevenness erosion, Ra did not well capture the profile change; but both Rsk and Rku showed elevation, indicating presence of high spikes and deep valleys on the 21-day sample.

