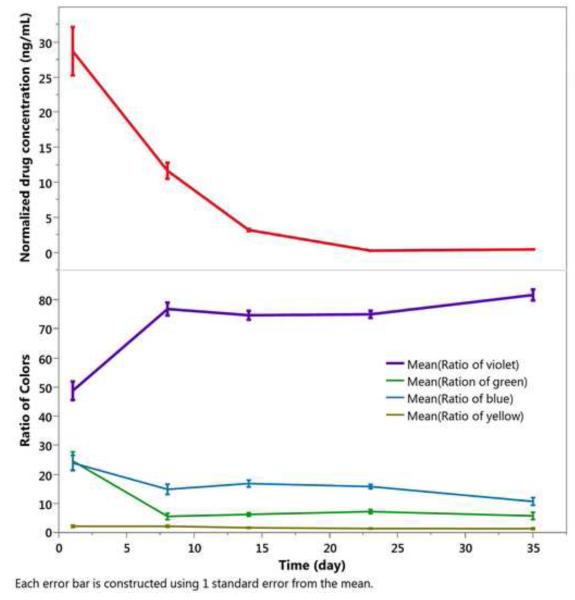
Figure 6.
Drug released and evolution of color classes as a function of time in vivo for the 2.45-inf-RAP pSi particle type injected into rabbit eyes at day 0. Each color class is normalized such that the total color in all channels sums to 100% for each time point. Each error bar is constructed using 1 standard error from the mean.

