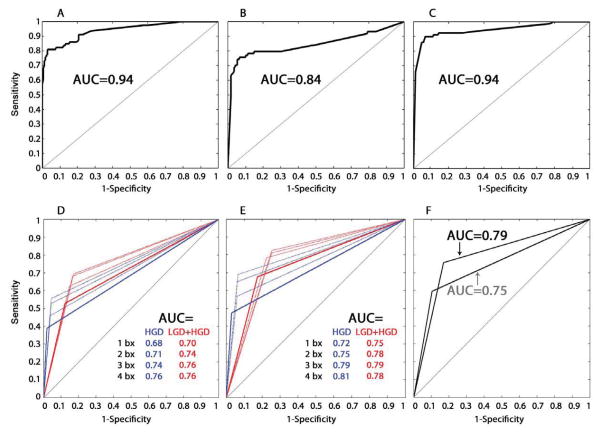
Fig. 4. ROC curves of EA risk prediction models, histopathology, and DNA content flow cytometry.
ROC curve of the T1-model applied to SCA data from T1 (A) or T2 (B) biopsies to predict EA risk. (C) ROC curve using the T1T2-model to predict EA risk based on maximum SCA calls by patient (T1+T2 data), where the maximum SCA at each of the 29 SCA features was used from any biopsy, regardless of whether it came from T1 or T2,. AUC=area under the ROC curve. (D–F) Histopathology and DNA content flow abnormalities were treated as binary variables to generate ROC curves, with each curve consisting of three points; one with sensitivity equal to 0 (perfect specificity), one with specificity equal to 0 (perfect sensitivity) and the third being the sensitivity and specificity for EA risk prediction of the binary variable. (D) ROC curves of histopathologic diagnosis of high-grade dysplasia (HGD) alone (blue), and low-grade dysplasia (LCD) and/or HGD (red) from 1, 2, 3, or 4 biopsies per 2 cm sampled in BE along the esophagus from T1 data. (E) ROC curves of histopathologic diagnosis of high-grade dysplasia (HGD) alone (blue), and low-grade dysplasia (LGD) and/or HGD (red) from 1, 2, 3, or 4 biopsies per 2 cm sampled in BE along the esophagus from combined T1+T2 data. (F) ROC curves of DNA content flow cytometric assessment of tetraploidy and/or aneuploidy from 1 biopsy per 2 cm in the esophagus from T1 (grey curve) and from combined T1+T2 data (black curve).

