
Figure 1.
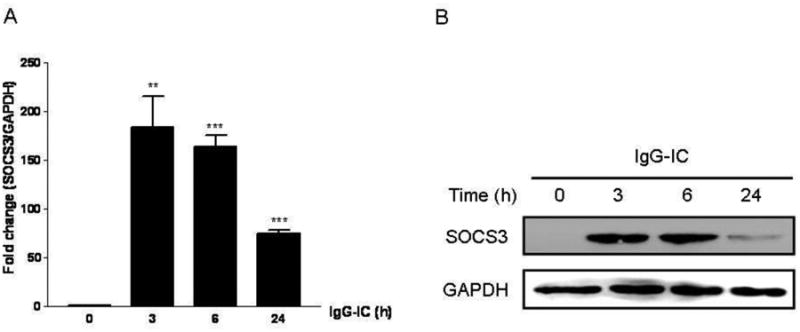
Effect of IgG IC on SOCS3 expression in RAW264.7 cells. RAW264.7 cells were stimulated by IgG IC for 0, 3 h, 6 h, and 24 h, respectively. A, total cellular RNAs were extracted, and real time-PCR was performed by using primers for SOCS3, and GAPDH, respectively. B, total cellular proteins were extracted, and Western blot was performed by using anti-SOCS3 antibody, and anti-GAPDH antibody, respectively. The level of GAPDH was shown at the bottom as a loading control. Data were expressed as means ± S. E. M. (n=3, biological replicates). *, and *** indicated statistically significant difference— p < 0.05, and p < 0.001, respectively.