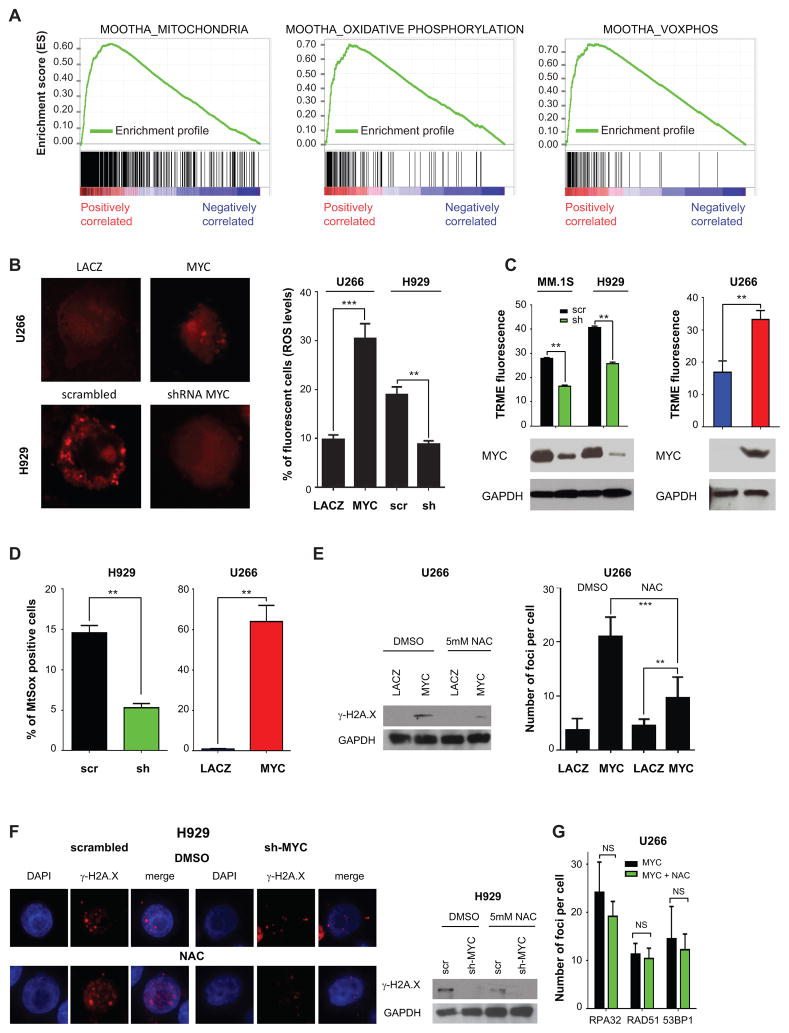
Figure 5. MYC induces oxidative stress mediating DNA damage in MM cells.
A, GSEA ES enrichment profiles for 559 patients divided in K1 and K2 groups of MOOTHA_MITOCHONDRIA (Left panel), MOOTHA_OXIDATIVE PHOSPHORYLATION (Middle panel), and MOOTHA VOXPHOS (Right panel) pathways as annotated in MSigDB. B, U266 cells were transfected with MYC-EGFP and LACZ-EGFP; superoxide levels were detected by immunofluorescence (Left panel), while ROS levels were evaluated by flow cytometry at 48 hours. C, TRME staining to detect active mitochondria upon MYC silencing in MM.1S and H929 or overexpression of MYC in U266 cells. Cells were gated to exclude Annexin V-FITC positive cells. Western blot analysis using antibodies against MYC and GAPDH levels is shown and is representative of one replicate experiment. The same cells were also used for experiments shown in panel B and D. D, MitoSOX staining upon MYC silencing in H929 cells or MYC overexpression in U266 cells. E, MYC-EGFP and LACZ-EGFP U266 transfected cells were treated with DMSO or 5mM N-Acetyl L-Cysteine (NAC) for 48 hours. Left panel: Western blot analysis for γ-H2A.X and GAPDH on U266 MYC-EGFP and LACZ-EGFP at 48 hours after transfection. Right panel: Immunofluorescence was performed. Number of γ-H2A.X foci was counted in up to 10 fields of cells per condition. F, H929 cells were silenced for MYC using a specific shRNA (#5) and scrambled vectors and incubated with DMSO or 5mM N-Acetyl Cysteine (NAC) for 48 hours. Immunofluorescence for γ-H2A.X foci (left panel) and western blot analysis using antibodies against γ-H2A.X and GAPDH (right panel). G, replicative stress markers in U266 overexpressing MYC after treatment with DMSO or NAC for 48 hours. The number of RPA32, RAD51, and RAD9A foci is shown.

