
Figure 1. Regional plots of the discovery and combined association results, recombination hotspots and linkage disequilibrium (LD) for the 9p24.1:14,081,842-14,398,982 osteosarcoma metastasis susceptibility locus.
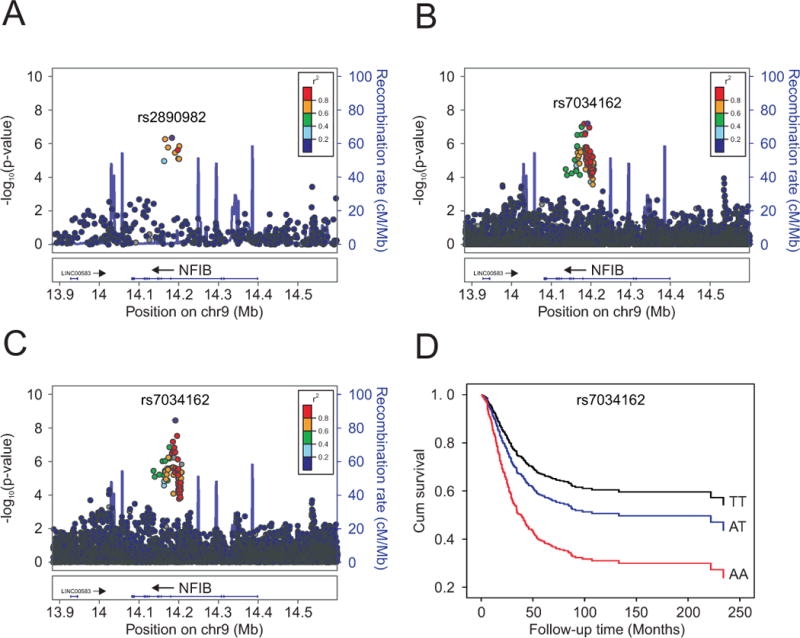
Y-axes represent the statistical significance (−log10 transformed P values) of SNP association results from a trend test (left) and the recombination rate (right). SNPs are color-coded based on pairwise linkage disequilibrium (r2) with the most statistically significant SNP. The most statistically significant SNP is labeled and shown in purple. Allelic P values generated by SNPTEST using score method (two-sided). Physical locations of the SNPs are based on NCBI human genome build 36, and gene annotation was based on the NCBI RefSeq genes from the UCSC Genome Browser. (A.) European discovery set, (B.) meta-analyzed European discovery and replication sets (imputed), (C.) meta-analyzed European discovery/replication sets, plus African and Brazilian ancestry cases (imputed). (D.) Kaplan-Meier curve of cumulative (cum) survival for osteosarcoma patients by rs7034162 genotype.