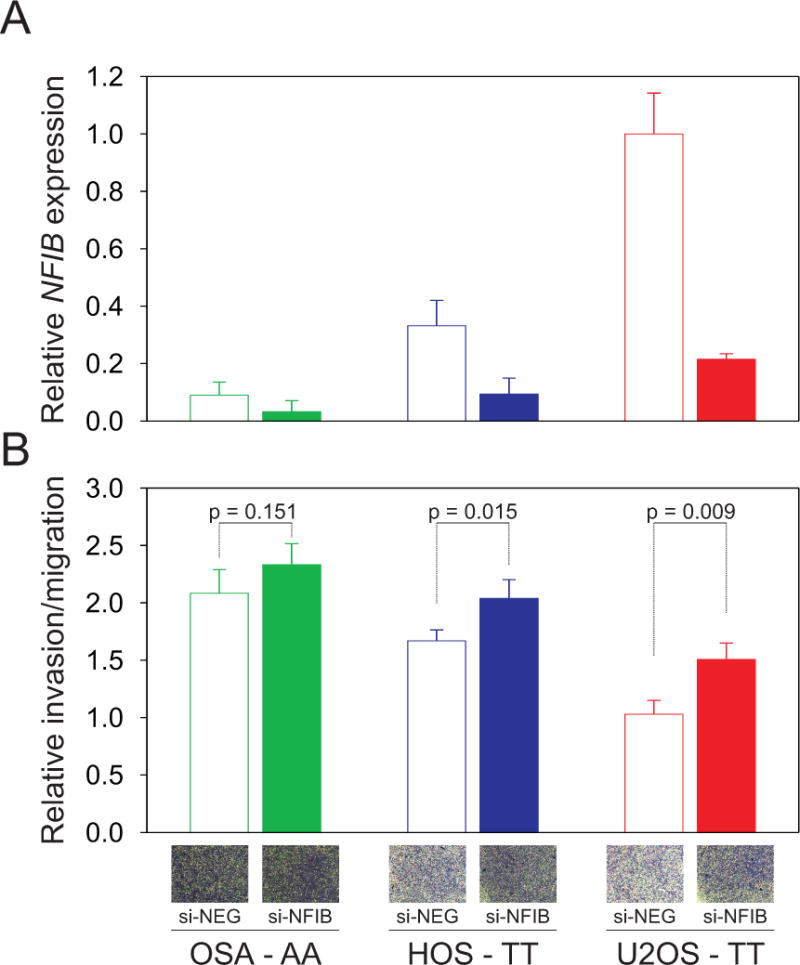
Figure 3. NFIB expression correlates with invasion and migration potential of human osteosarcoma cells.

(A.) NFIB expression in OSA, HOS and U2OS cells was determined 48 hours after transfection with control siRNA (si-NEG) or siRNA targeting NFIB (si-NFIB). Graphs show relative expression compared with control treated U2OS cells. The rs7034162 genotype is shown for the osteosarcoma cell lines: U2OS and HOS cells carry the homozygous non-risk allele (TT), and OSA cells carry the homozygous risk allele (AA). (B.) 48 hours after NFIB suppression, cells were evaluated for migratory potential. Cells that invaded through the matrigel-coated membrane inserts were stained with crystal violet, air-dried and bright field images were taken (inset photographs depict staining intensity differences). To quantify cell invasion/migration, the inserts were treated with 200μl of methanol and the absorbance measured in triplicate at 560 nm. Invading cells are depicted relative to control treated U2OS cell. Results of at least three experiments in triplicate are expressed as mean ± SD. The invasion and migration rate of each cell line was inversely correlated with NFIB expression levels.
